By Cicily Maton, Retired Sr. Financial Planner
Cicily Maton has retired, however, Michelle Maton CFP®, EA, CeFT® Sr. Financial Planner and Andy Baxley CFP®, CIMA®, CeFT® Sr. Financial Planner carry on her legacy in the Chicago office.

We all know there is a presidential election coming. It’s in the news, on television, Tweets, Facebook, Zoom. We can’t get away from it.
There will be a continuous flow of information and misinformation from many sources who know, without a doubt, how the market will react depending on who wins the election. It has always been so. This will be the eighth presidential election cycle that I have witnessed since I became a financial planner. It is always exactly the same. Pundits on one side are certain that if the other side wins, the stock market (and maybe even the bond market) will tank and the path forward for the economy will lead to disaster. Prognosticators for the other side predict the same dire results if their candidate isn’t successful.
And in every election cycle I receive at least one or two phone calls from either friends or clients asking if they should make adjustments to their investment strategy because of the coming doom if one or the other candidates get elected. Right on schedule I received a call last week. My caller had been to a meeting in which someone was recounting their investment moves in anticipation of an adverse election result. They were selling “everything.” Then I had a second call from a client who had a conversation with his next-door neighbor who was liquidating all of his equities and buying gold. Perhaps it is now time for a review of the research and how we can make use of that information to make better investment decisions.
The findings from the Schwab Center for Financial Research shows that the market ended on a positive note in 17 of the past 23 presidential election years – or 74% of the time – with an average annual return of 7.1%. But investors still ask if politics drive the market. First, let’s recognize that many things influence the market, business cycles, corporate profits, and unexpected events, like a pandemic. It is impossible to attribute election results as the only influencer to market returns.
Looking beyond the year of the presidential election, what might be the effect of whether a Republican or a Democrat is elected? An article in Forbes reminds us of the long held conventional wisdom that says liberal Democrats are generally bad for the economy, and the stock market, because of their big government tendencies, while fiscally conservative Republicans are good for the economy (and the stock market). Forbes calls this widely accepted belief as “fake news.” The fact is that from 1952 through June 2020 the annualized stock market returns under Democrats has been 10.6% compared to 4.8% for Republicans.
Jurrien Timmer, Director of Global Macro for Fidelity, has taken his research on presidential election cycles back to the year 1789. He concludes that there are consistent patterns that show the first 2 years of a presidential term tended to indicate below-average returns while the last 2 year have been above average. In the end, Mr. Timmer concludes, it comes back to fundamentals: earnings, interest rates, labor growth, productivity, and independent monetary policy. In short, the economy and the market are simply bigger than whatever direction the political wind is blowing.
It can be financial disaster for political passions to influence investment decisions. For example, if you had sold your equity portfolio prior to 11/4/2008 (fearing an Obama sell off) and were out of the market until 11/8/2016, you would have not participated in a 153.3% gain, based on S&P500 Index. Plus, you would have paid Long Term Capital Gains on the proceeds for your 2008 sale.
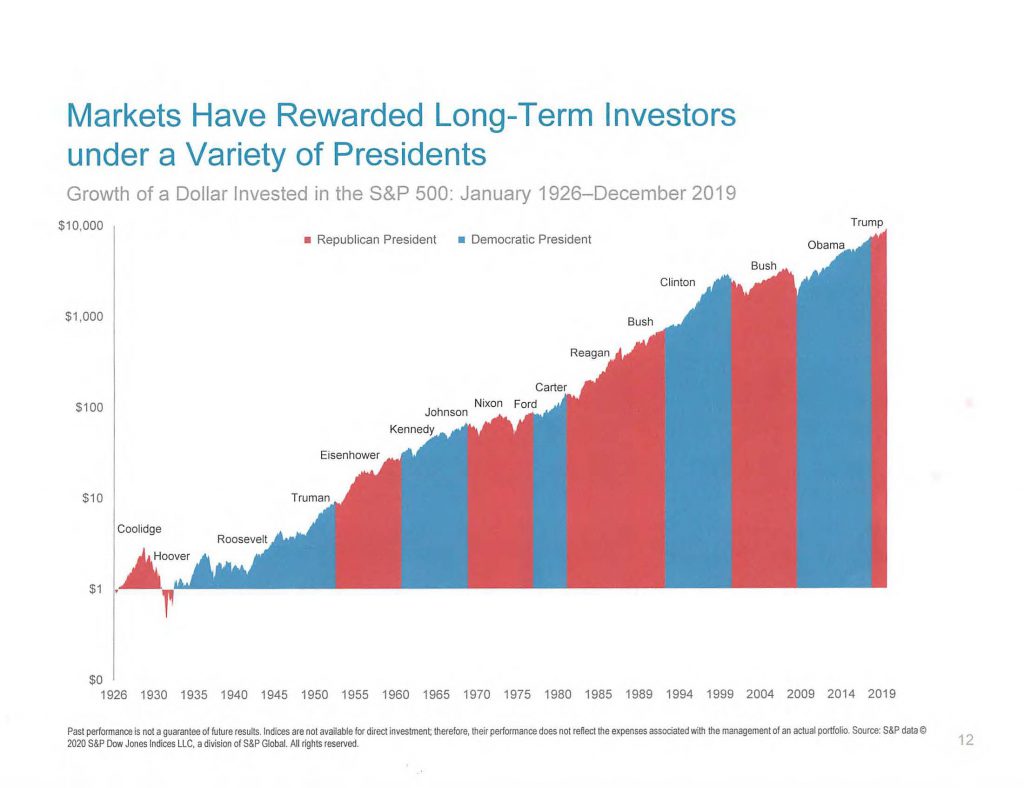
DFA (Dimensional Fund Advisors) recently updated the data of stock market performance during different election cycles and presidential terms. Using the S&P 500 Index, the average return in the year of an election was 11.3% and the average return in the year subsequent to the election was 9.9%. The average annualized returns during the four-year presidential terms was 10.3%, with only four out of 23 returning negative returns and one of those was Hoover (1929-1932). The following DFA chart illustrates growth of a dollar invested in the S&P 500 from 1926-2019, during presidential terms
I have four suggestions:
- Turn off the TV
- Stop delivery of the newspapers
- Stay off Twitter
- Don’t engage in political-economic conversations with you neighbors.
What matters most is staying invested. It’s time, not timing, that makes the difference. As always, if you are in doubt, call your financial planner at TPC.