by Michael Branham, CFP®

What a wild 2020 we’re having! The impeachment hearings in early 2020 are but a distant memory, with coronavirus and social justice headlines leading the way since mid-March and June, respectively. You have experienced one of the wildest stock market rollercoasters in memory, with massive declines in March and a resurgence in market indexes (at least US market indexes) over the past 4 months. As far as stock markets go, we’re back in business, right?
In true 2020 fashion, individual returns are a bit confounding to clients. They see the news of the S&P 500 hitting all-time highs and wonder why their portfolio returns aren’t on par. To be fair, it has been a tough year to have a diversified portfolio with broad exposure to different stock asset classes around the globe. Like the past several years, US stock markets are leading the way, but the real story of returns this year is even more concentrated than that.
Wall Street and market pundits will talk about “market breadth”, which is simply a measure of how many stocks in an index are experiencing the gains you’re hearing about. The short answer is that current market gains are very “narrow”, meaning very few US companies are driving stock market growth, while many US stock indexes are actually negative year to date.
Take the NASDAQ, for example. This index tracks roughly 3300 US companies and represents stocks traded on the NASDAQ stock exchange, many of which are “growth” companies, and household names. In 2020 the 10 largest stocks on the NASDAQ have accounted for the vast majority of the index’s gain, with the remaining stocks having predominantly negative returns for the year.
Another fun acronym you might hear in your market reading is FAANG, referring to the “fab five” stocks in the US stock market today, which account for the majority of all US stock returns in 2020. Those companies are Facebook, Apple, Amazon, Netflix and Google (actually, parent company Alphabet).
You can further see the disparity of 2020 returns looking at the Russell Indexes, which are another measure of US stock market return (similar to what the S&P 500 provides). If you look at YTD numbers (as of August 19th, 2020) you’ll see:
| Russell Index | What does it measure? | YTD Return (8/19) |
| Russell 1000 | US large company stock performance | 6.27% |
| Russell 2000 | US small company stock performance | -4.96% |
| Russell 3000 | US large and Small combined (total market) | 5.54% |
| Russell Microcap | US smallest of the small publicly traded stocks | -2.54% |
| Russell Midcap | US mid-sized company stock performance | -1.76% |
| Russell Top 500 | Top 500 companies (by size) in the Russell 1000 | 7.22% |
| Russell Top 50 Mega | Top 50 companies (by size) in the Russell 1000 | 14.36% |
Global stock indexes will look similar to the Russell small and mid-cap indexes YTD, so the takeaway here is that within the US stock market categories, large US companies are driving this year’s stock market returns, and it’s a very short (or narrow, to stay on theme) list!
The good news is that investing is not a one-year game, it’s a series of one-year games all strung together. In other words, we have to think longer term when building responsible, diversified portfolios. We know that this year’s stock market winners may not, and likely will not, be next year’s winners. We build portfolios with exposure to multiple asset classes to ensure we don’t have to guess, or predict, what will happen in a given year. Inevitably, a diversified portfolio’s returns will not match the return of that year’s top category, and also won’t sink as low as the category with the poorest returns. The goal is to smooth out the ride over longer periods of time, and to understand that there’s typically a “reversion to the mean”. This simply suggests that we have much better data on your “average” market return, by asset class, over a long period of time, and that today’s “dogs” will have their day in the sun again. If you extend our previous chart you can begin to see that take shape in the 10-year returns, though it’s still a 10-year period where US large companies led the world’s growth:
| Russell Index | What does it measure? | YTD Return (8/19) | 10Y |
| Russell 1000 | US large company stock performance | 6.27% | 14.48% |
| Russell 2000 | US small company stock performance | -4.96% | 11.44% |
| Russell 3000 | US large and Small combined (total market) | 5.54% | 14.26% |
| Russell Microcap | US smallest of the small publicly traded stocks | -2.54% | 11.21% |
| Russell Midcap | US mid-sized company stock performance | -1.76% | 12.71% |
| Russell Top 500 | Top 500 companies (by size) in the Russell 1000 | 7.22% | 14.68% |
| Russell Top 50 Mega | Top 50 companies (by size) in the Russell 1000 | 14.36% | 15.42% |
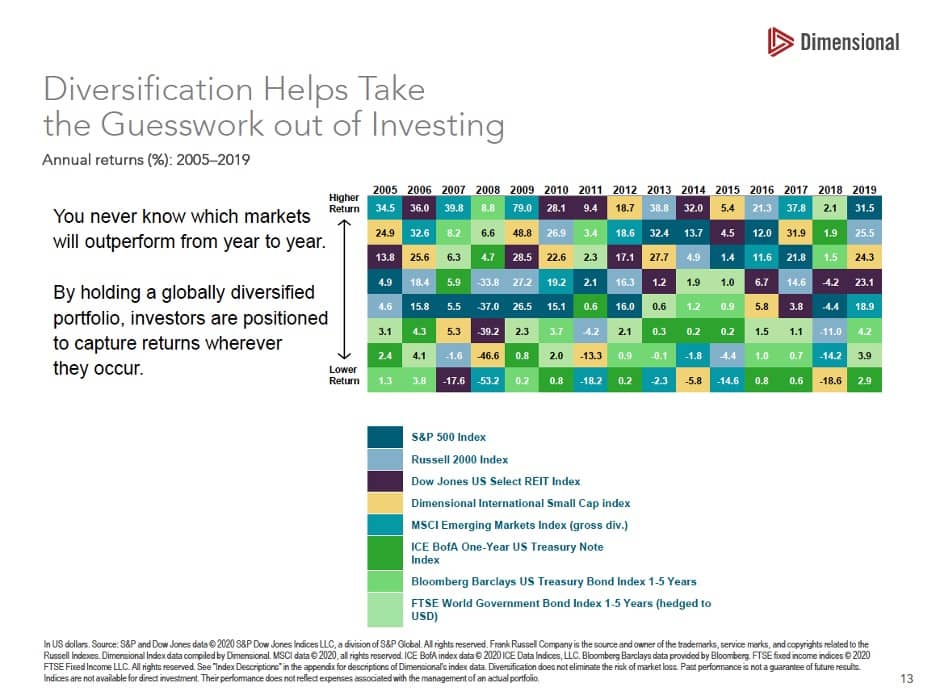
We again ignored global indexes to make the point, but you’ve likely seen periodic table style investment charts showing the randomness of annual returns. These depict how rarely the same asset class, US or Global, “wins” as the highest returner in a given year. Below is an example showing returns from Domestic Stocks, International Stocks, and even Bond indexes which illustrates that leading in one year doesn’t have any ability to predict which market segment will lead the next.
Building portfolios through prediction is a fool’s errand. Using long-term, verifiable data with a consistent approach to investing will be the best path toward your goals. Choosing market-based funds with low internal cost will also help bolster your returns. These principles, combined with our regular rebalancing, will foster the “buy low, sell high” mantra of every investor (more to come on our rebalancing impact in an upcoming blog).
As you read or watch news about stock market returns think beyond the immediate reaction of “how does my return today stack up?” Your portfolio will have captured some of the gains or losses you’re seeing and will include other components that have different returns because they are invested differently. Our main goal is to help you achieve the goals you’ve laid out in your financial plan, and to continually monitor and adjust as needed. To do so requires us to invest with logic not emotion, to plan not react, and to understand the long-term trends and data available in building the right portfolio for you. As always, we’re here to chat further about how it all works! Contact your TPC planner to schedule a call if you or anybody you care about has questions about market performance, or more importantly your individual portfolio. If you sense that any family members, friends, or colleagues are at all unsettled with current market volatility we’d be glad to speak with them and provide a second opinion.

Michael Branham, CFP® is a Sr. Financial Planner in the Alaska office of The Planning Center, a fee-only financial planning and wealth management firm. Email him at mike@theplanningcenter.com.