This report features world capital market performance and a timeline of events for the past quarter. It begins with a global overview, then features the returns of stock and bond asset classes in the US and international markets. The report also illustrates the impact of globally diversified portfolios.
World Stock Market Performance
MSCI All Country World Index with selected headlines from Q3 2018
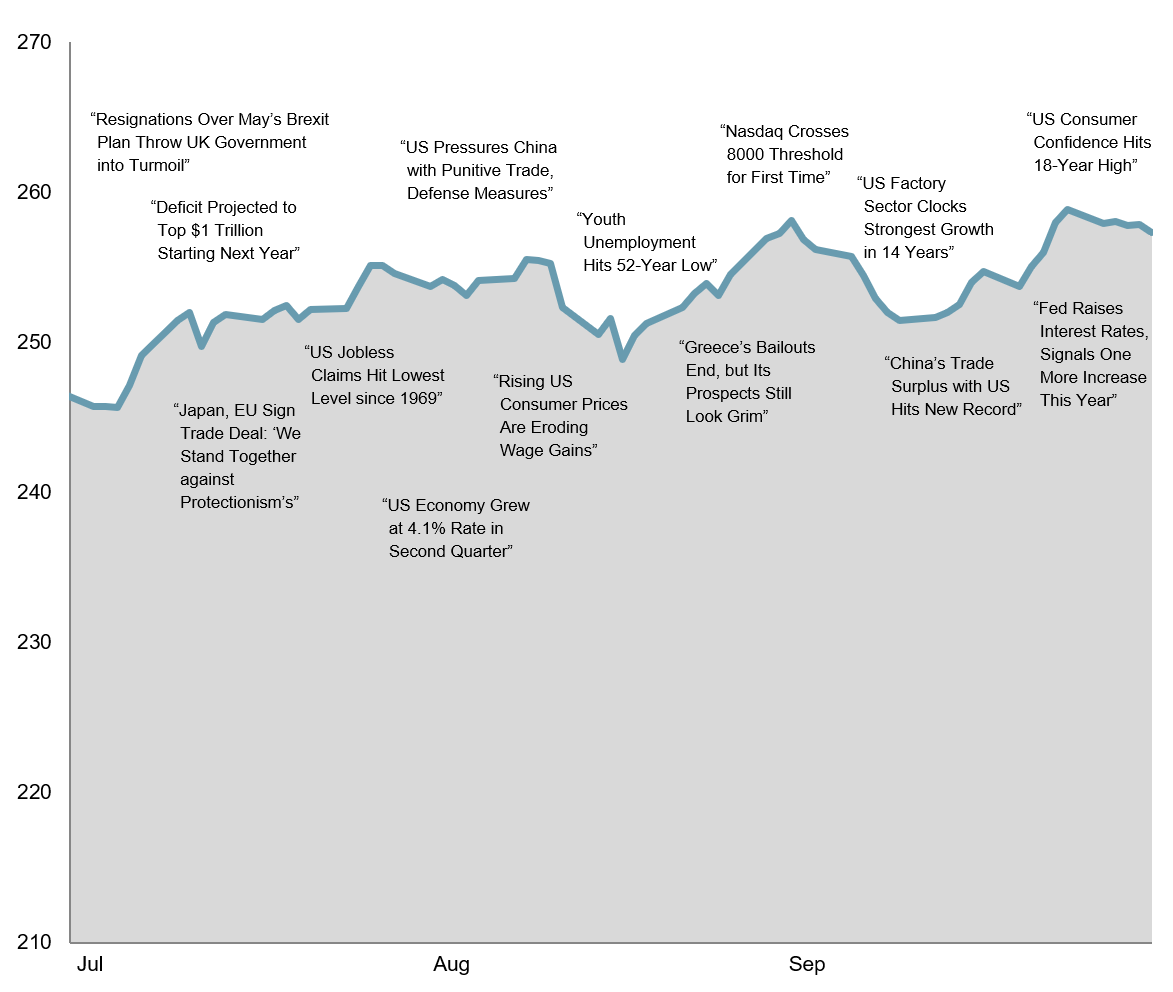
These headlines are not offered to explain market returns. Instead, they serve as a reminder that investors should view daily events from a long-term perspective and avoid making investment decisions based solely on the news.
World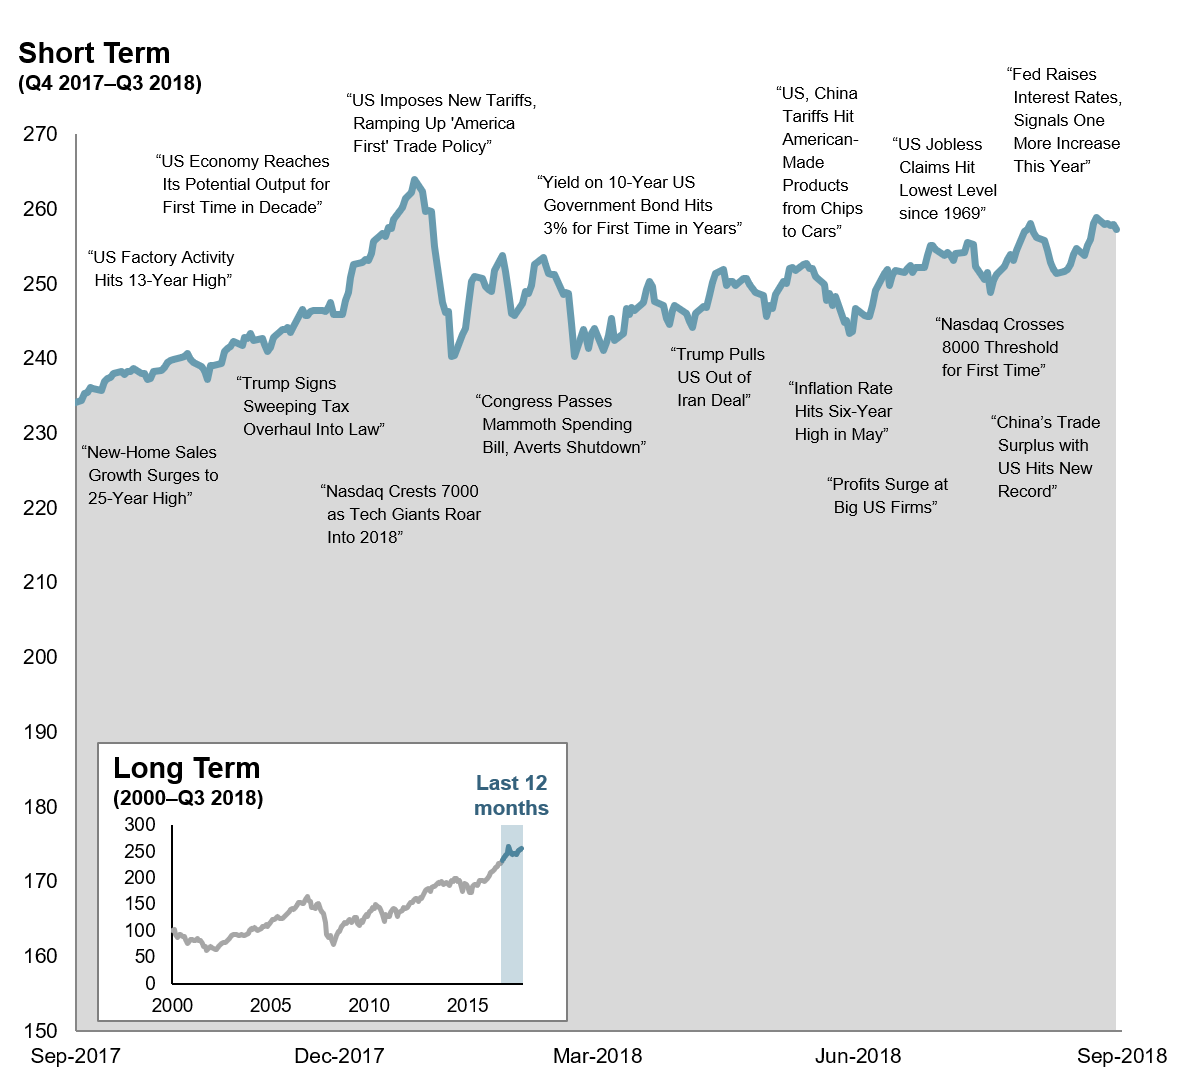
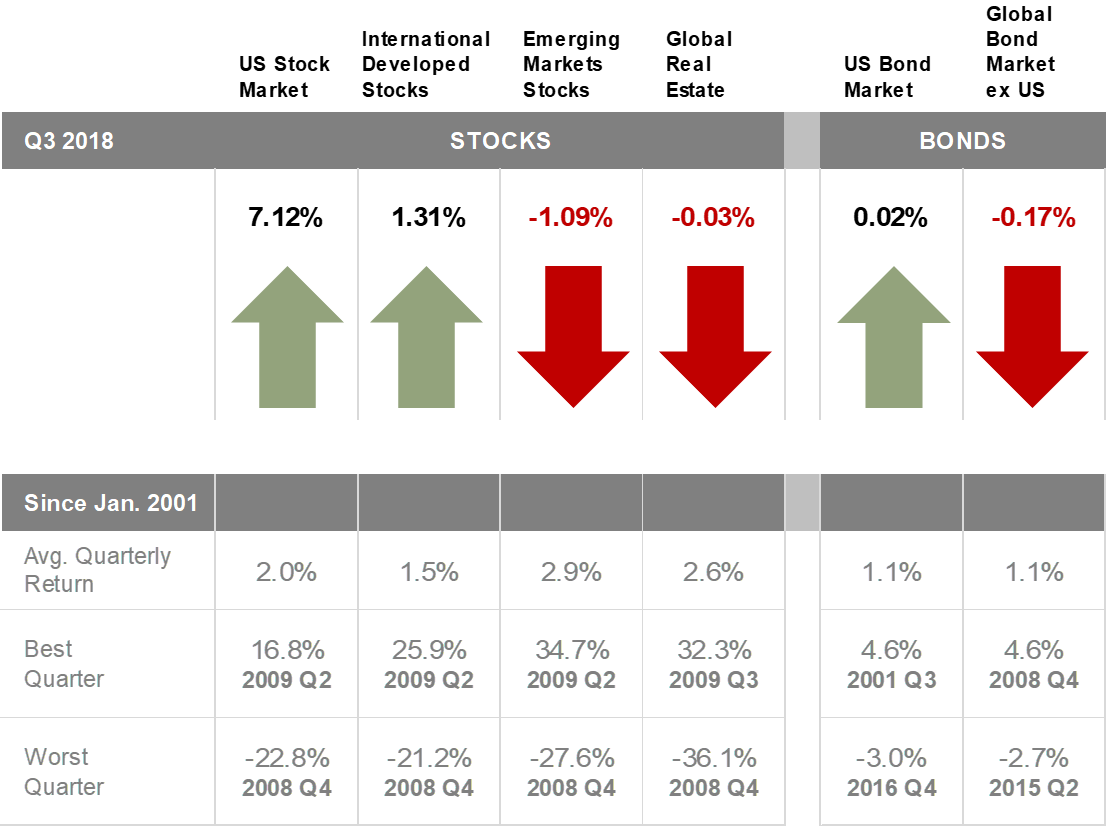
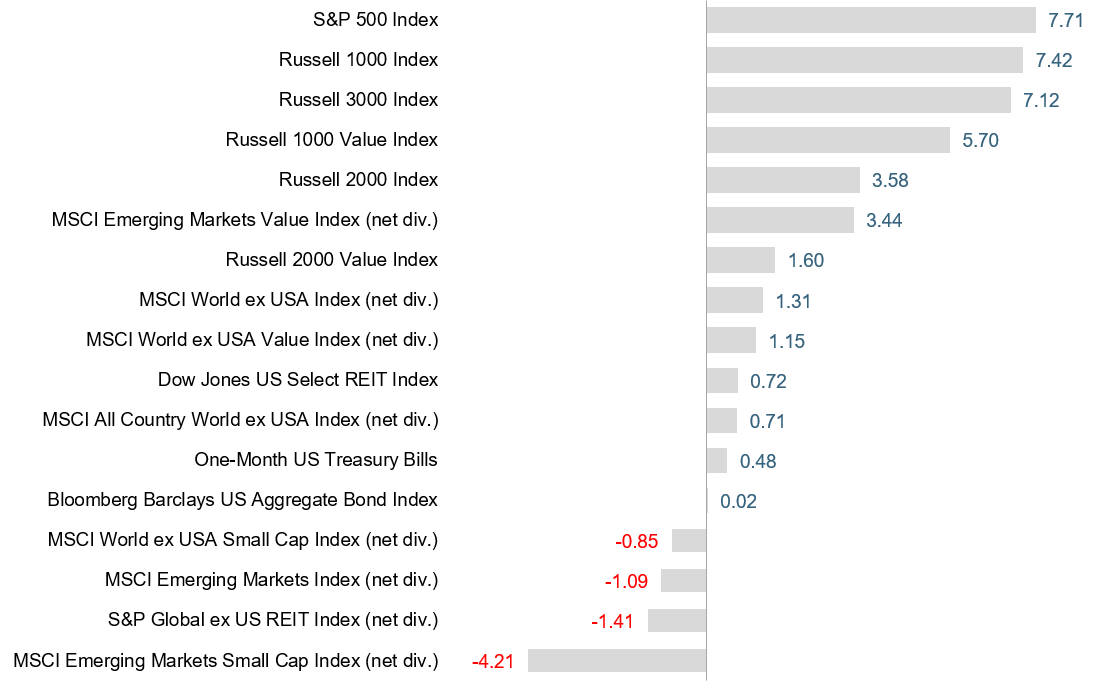
World Asset Classes
Third Quarter 2018 Index Returns (%)
Looking at broad market indices, the US outperformed non-US developed and emerging markets during the quarter.
Small caps underperformed large caps in the US, non-US developed, and emerging markets. The value effect was positive in emerging markets but negative in the US and non-US developed markets.
REIT indices underperformed equity market indices in both the US and non-US developed markets.
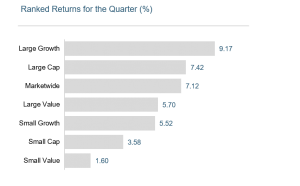
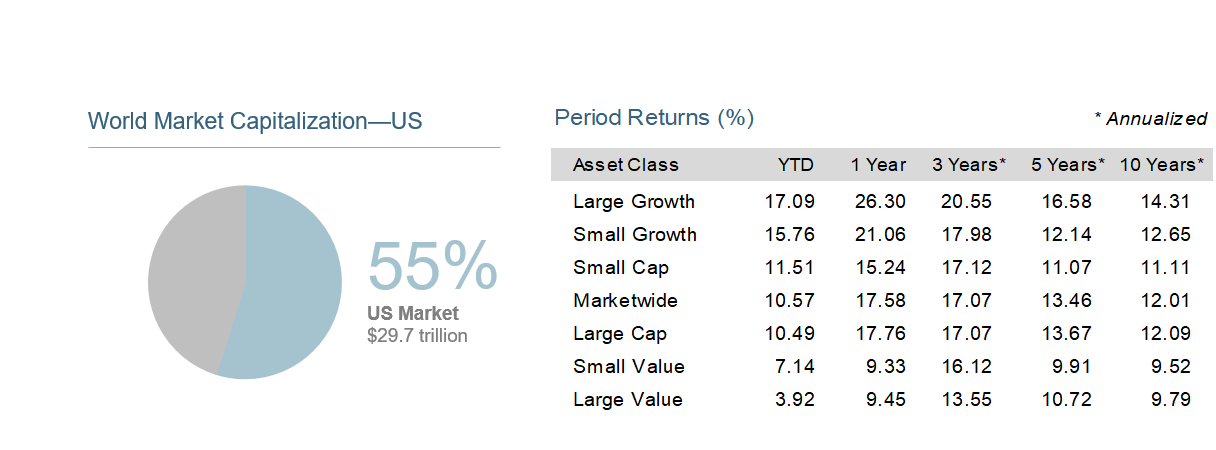
US Stocks
Third Quarter 2018 Index Returns
 The US equity market posted a positive return, outperforming both non-US developed and emerging markets.
Value underperformed growth in the US across large and small cap stocks.
Small caps underperformed large caps in the US.
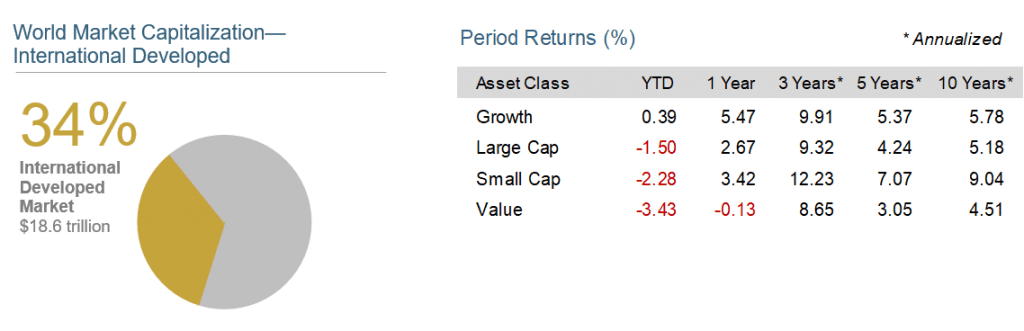
International Developed Stocks
Third Quarter 2018 Index Returns
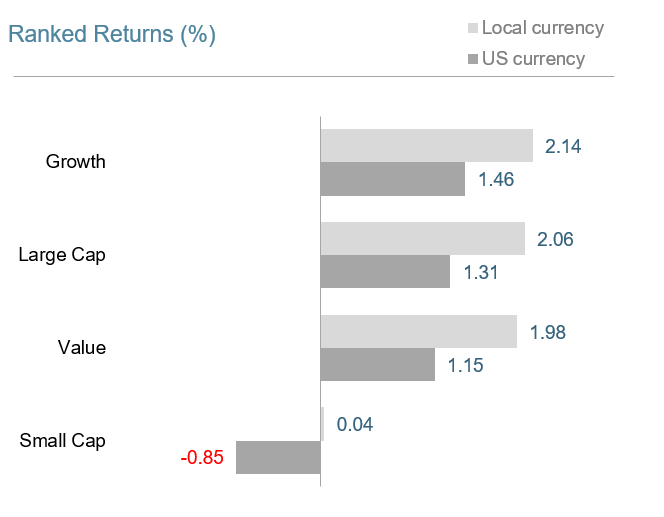
In US dollar terms, developed markets outside the US underperformed the US but outperformed emerging markets during the quarter.
Large cap value stocks underperformed large cap growth stocks in non-US developed markets; however, small cap value outperformed small cap growth.
Small caps underperformed large caps in non-US developed markets.
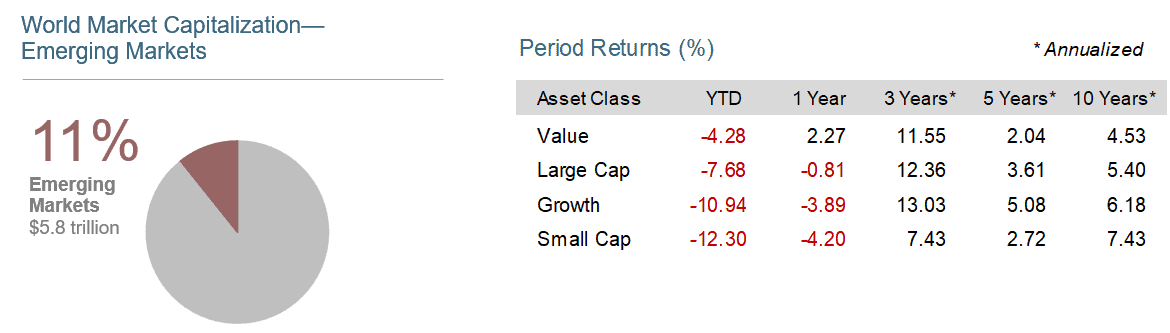
 Emerging Markets Stocks
Third Quarter 2018 Index Returns
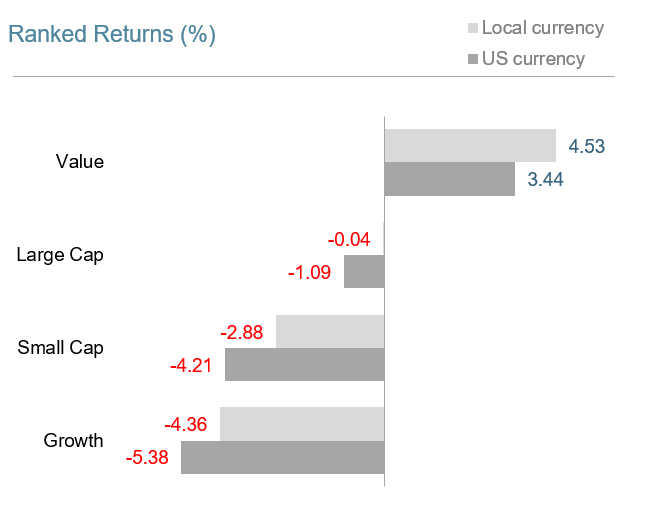 In US dollar terms, emerging markets posted negative returns for the quarter, underperforming developed markets including the US.
The value effect was positive, particularly in large caps in emerging markets.
Small caps underperformed large caps.
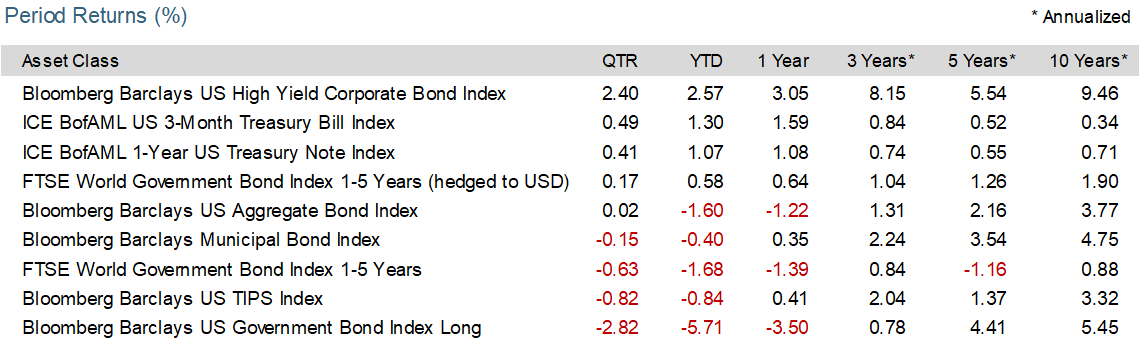
Fixed Income
Third Quarter 2018 Index Returns
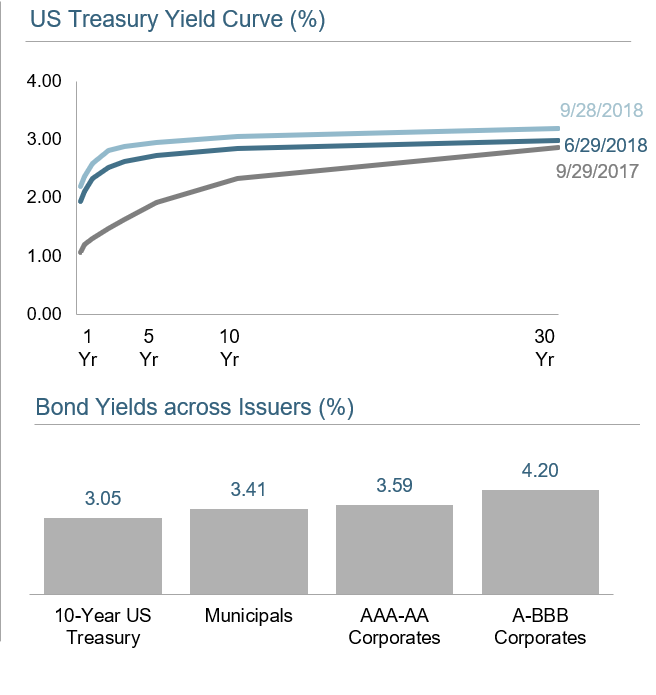 Interest rates increased in the US during the third quarter. The yield on the 5-year Treasury note rose 21 basis points (bps), ending at 2.94%. The yield on the 10-year Treasury note increased 20 bps to 3.05%. The 30-year Treasury bond yield rose 21 bps to 3.19%.
On the short end of the yield curve, the 1-month Treasury bill yield increased 35 bps to 2.12%, while the 1-year Treasury bill yield rose 26 bps to 2.59%. The 2-year Treasury note yield finished at 2.81% after an increase of 29 bps.
In terms of total return, short-term corporate bonds gained 0.71%, while intermediate-term corporates returned 0.80%.
Short-term municipal bonds declined 0.11%, while intermediate-term munis dipped 0.06%. Revenue bonds (‒0.16%) performed in line with general obligation bonds (‒0.14%).
Impact of Diversification
Third Quarter 2018 Index Returns
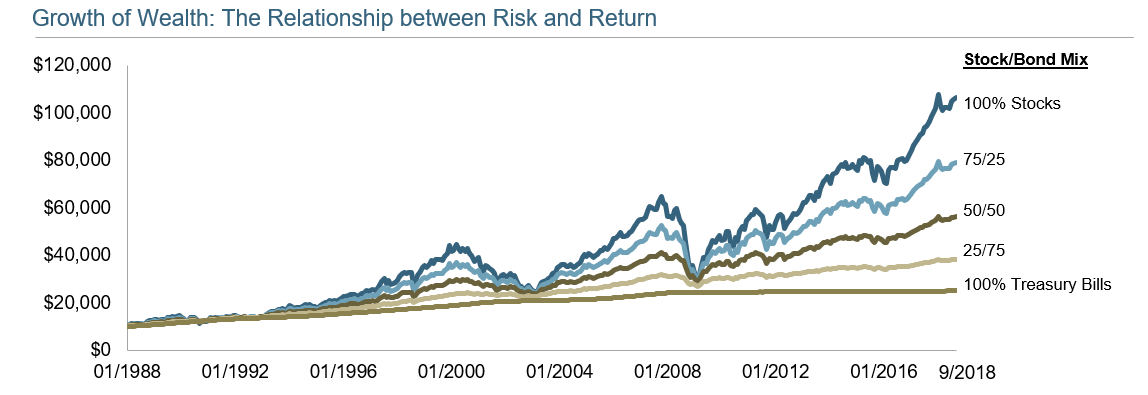
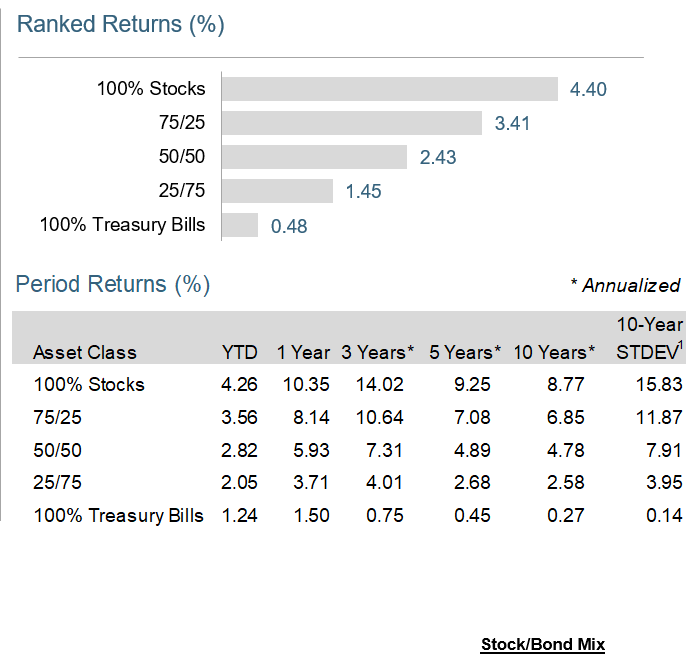 These portfolios illustrate the performance of different global stock/bond mixes and highlight the benefits of diversification. Mixes with larger allocations to stocks
are considered riskier but have higher expected returns over time.
Total Cost of Ownership
Costs matter. Whether you’re buying a car or selecting an investment strategy, the costs you expect to pay are likely to be an important factor in making any major financial decision.
People rely on a lot of different information about costs to help inform these decisions. When you buy a car, for example, the sticker price indicates approximately how much you can expect to pay for the car itself. But the costs of car ownership do not end there. Taxes, insurance, fuel, routine maintenance, and unexpected repairs are also important considerations in the overall cost of a car. Some of these costs are easily observed, while others are more difficult to assess. Similarly, when investing in mutual funds, different variables need to be considered to evaluate how cost‑effective a strategy may be for a particular investor.
Expense Ratios
 Mutual funds have many costs, all of which affect the net return to investors. One easily observable cost is the expense ratio. Like the sticker price of a car, the expense ratio tells you a lot about what you can expect to pay for an investment strategy. Expense ratios strongly influence fund selection for many investors, and it’s easy to see why.
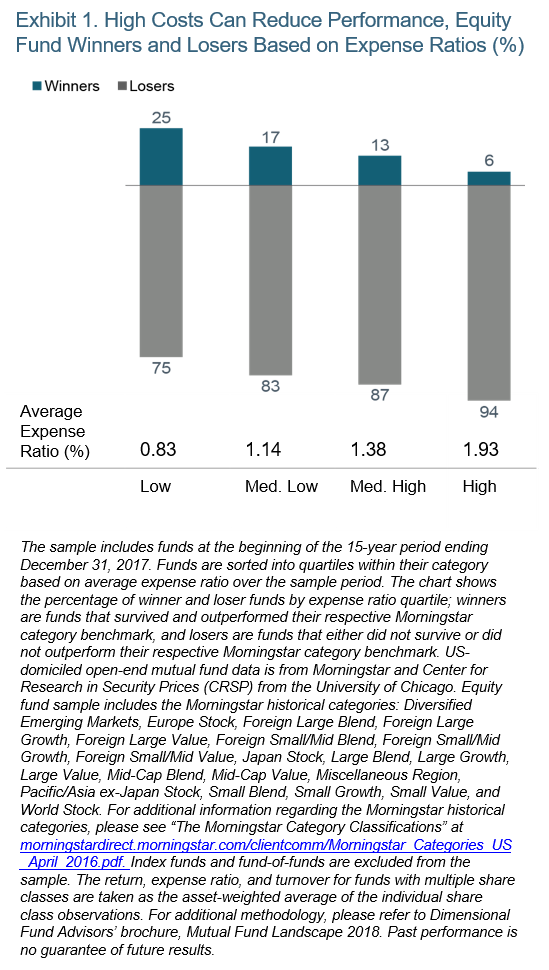
Exhibit 1 illustrates the out-performance rate, or the percentage of funds that beat their category index, for active equity mutual funds over the 15-year period ending December 31, 2017. To see the link between expense ratio and performance, out-0performance rates are shown for quartiles of funds sorted by their expense ratio. As the chart shows, while active funds have mostly lagged indices across the board, the out-performance rate has been inversely related to expense ratio. Just 6% of funds in the highest expense ratio quartile beat their index, compared to 25% for the lowest expense ratio group.
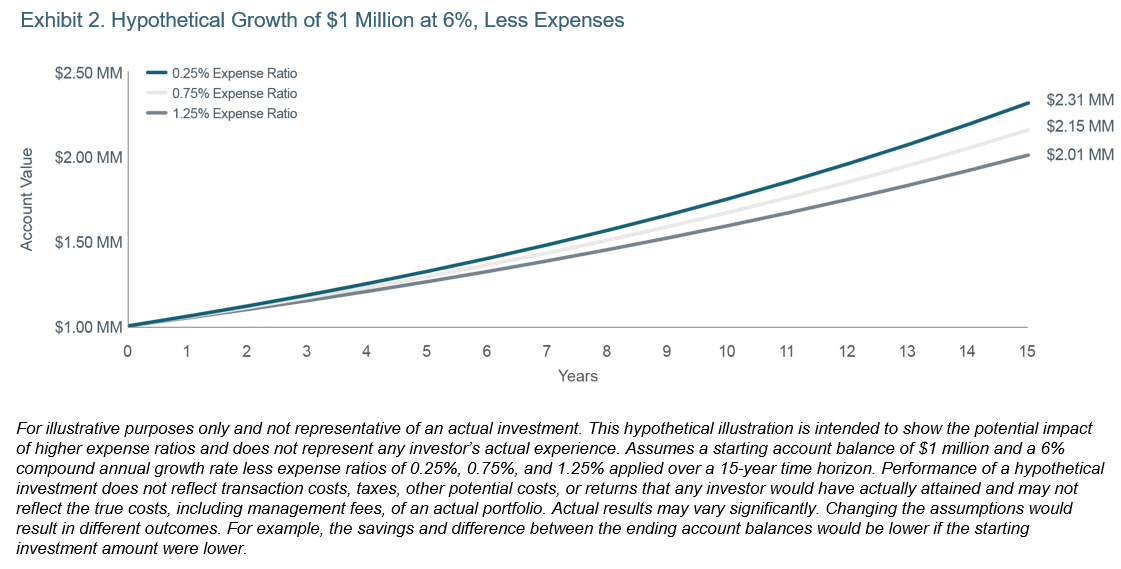
This data indicates that a high expense ratio presents a challenging hurdle for funds to overcome, especially over longer time horizons. From the investor’s point of view, an expense ratio of 0.25% vs. 1.25% means savings of $10,000 per year on every $1 million invested. As Exhibit 2 helps to illustrate, those dollars can really add up over time.
Going Beyond The Expense Ratio
The poor track record of mutual funds with high expense ratios has led many investors to select mutual funds based on expense ratio alone. However, as with a car’s sticker price, an expense ratio is not an all-encompassing measure of the cost of ownership. Take, for example, index funds, which often rank near the bottom of their peers on expense ratio.
Index funds are designed to track or match the components of an index formed by an index provider, such as Russell or MSCI. Important decisions in the investment process, such as which securities to include in the index, are outsourced to an index provider and are not within the fund manager’s discretion. For example, the prescribed reconstitution schedule for an index, which is the process of deleting or adding certain stocks to the index, may cause index funds to buy stocks when buy demand is high and sell stocks when buy demand is low. This price-insensitive buying and selling may be required so that the index fund can stay true to its investment mandate of tracking an underlying index. This can result in suboptimal transaction prices for the index fund and diminished overall returns. In other words, for a given amount of trading (or turnover), the cost per unit of trading may be higher for such a strictly regimented approach to investing. Moreover, this cost will not appear explicitly to investors assessing such a fund on expense ratio alone. Further, because indices are reconstituted infrequently (typically once per year), funds seeking to track them may also be forced to buy and sell holdings based on stale eligibility criteria. For example, the characteristics of a stock considered a value stock¹ as of the last reconstitution date may change over time, but between reconstitution dates, those changes would not affect that stock’s inclusion or weighting in a value index. That means incoming cash flows to a value index fund could actually be used to purchase stocks that currently look more like growth stocks² and vice versa. Metaphorically, these managers’ attention may be more focused on the rear-view mirror than on the road ahead for investors.
For active approaches like stock picking, both the total amount of trading and the cost per trade may be high. If a manager trades excessively or inefficiently, costs like commissions and price impact from trading can eat away at returns. Viewed through the lens of our car analogy, this impact is like the toll on your vehicle from incessantly jamming the brakes or accelerating quickly. Subjecting the car to such treatment may result in added wear and tear and greater fuel consumption, increasing your total cost of ownership. Similarly, excessive trading can lead to negative tax consequences for a fund, which can increase the cost of ownership for investors holding funds in taxable accounts. Such trading costs can be reduced by avoiding unnecessary turnover and seeking to minimize the cost per trade.
In contrast to both highly regimented indexing and high-turnover active strategies, employing a flexible investment approach that reduces the need for immediacy, and thus enables opportunistic execution, is one way to potentially reduce implicit costs. Keeping turnover low, remaining flexible, and transacting only when the potential benefits of a trade outweigh the costs can help keep overall trading costs down and help reduce the total cost of ownership.
Conclusion
The total cost of ownership of a mutual fund can be difficult to assess and requires a thorough understanding of costs beyond what an expense ratio can tell investors on its own. We believe investors should look beyond any one cost metric and instead evaluate the total cost of ownership of an investment solution.
- A stock trading at a low price relative to a measure of fundamental value, such as book value or earnings.
- A stock trading at a high price relative to a measure of fundamental value, such as book value or earnings
Source: Dimensional Fund Advisors LP.
There is no guarantee investment strategies will be successful. Diversification does not eliminate the risk of market loss. Mutual fund investment values will fluctuate and shares, when redeemed, may be worth more or less than original cost. The types of fees and expenses will vary based on investment vehicle. Investments are subject to risk including possible loss of principal.
All expressions of opinion are subject to change. This article is distributed for informational purposes, and it is not to be construed as an offer, solicitation, recommendation, or endorsement of any particular security, products, or services.
Quarterly Market Review – Q3 2018
This report features world capital market performance and a timeline of events for the past quarter. It begins with a global overview, then features the returns of stock and bond asset classes in the US and international markets. The report also illustrates the impact of globally diversified portfolios.
World Stock Market Performance
MSCI All Country World Index with selected headlines from Q3 2018
These headlines are not offered to explain market returns. Instead, they serve as a reminder that investors should view daily events from a long-term perspective and avoid making investment decisions based solely on the news.
World
World Asset Classes
Third Quarter 2018 Index Returns (%)
Looking at broad market indices, the US outperformed non-US developed and emerging markets during the quarter.
Small caps underperformed large caps in the US, non-US developed, and emerging markets. The value effect was positive in emerging markets but negative in the US and non-US developed markets.
REIT indices underperformed equity market indices in both the US and non-US developed markets.
US Stocks
Third Quarter 2018 Index Returns
Value underperformed growth in the US across large and small cap stocks.
Small caps underperformed large caps in the US.
International Developed Stocks
Third Quarter 2018 Index Returns
In US dollar terms, developed markets outside the US underperformed the US but outperformed emerging markets during the quarter.
Large cap value stocks underperformed large cap growth stocks in non-US developed markets; however, small cap value outperformed small cap growth.
Small caps underperformed large caps in non-US developed markets.
Third Quarter 2018 Index Returns
The value effect was positive, particularly in large caps in emerging markets.
Small caps underperformed large caps.
Fixed Income
Third Quarter 2018 Index Returns
On the short end of the yield curve, the 1-month Treasury bill yield increased 35 bps to 2.12%, while the 1-year Treasury bill yield rose 26 bps to 2.59%. The 2-year Treasury note yield finished at 2.81% after an increase of 29 bps.
In terms of total return, short-term corporate bonds gained 0.71%, while intermediate-term corporates returned 0.80%.
Short-term municipal bonds declined 0.11%, while intermediate-term munis dipped 0.06%. Revenue bonds (‒0.16%) performed in line with general obligation bonds (‒0.14%).
Impact of Diversification
Third Quarter 2018 Index Returns
are considered riskier but have higher expected returns over time.
Total Cost of Ownership
Costs matter. Whether you’re buying a car or selecting an investment strategy, the costs you expect to pay are likely to be an important factor in making any major financial decision.
People rely on a lot of different information about costs to help inform these decisions. When you buy a car, for example, the sticker price indicates approximately how much you can expect to pay for the car itself. But the costs of car ownership do not end there. Taxes, insurance, fuel, routine maintenance, and unexpected repairs are also important considerations in the overall cost of a car. Some of these costs are easily observed, while others are more difficult to assess. Similarly, when investing in mutual funds, different variables need to be considered to evaluate how cost‑effective a strategy may be for a particular investor.
Expense Ratios
Exhibit 1 illustrates the out-performance rate, or the percentage of funds that beat their category index, for active equity mutual funds over the 15-year period ending December 31, 2017. To see the link between expense ratio and performance, out-0performance rates are shown for quartiles of funds sorted by their expense ratio. As the chart shows, while active funds have mostly lagged indices across the board, the out-performance rate has been inversely related to expense ratio. Just 6% of funds in the highest expense ratio quartile beat their index, compared to 25% for the lowest expense ratio group.
This data indicates that a high expense ratio presents a challenging hurdle for funds to overcome, especially over longer time horizons. From the investor’s point of view, an expense ratio of 0.25% vs. 1.25% means savings of $10,000 per year on every $1 million invested. As Exhibit 2 helps to illustrate, those dollars can really add up over time.
Going Beyond The Expense Ratio
The poor track record of mutual funds with high expense ratios has led many investors to select mutual funds based on expense ratio alone. However, as with a car’s sticker price, an expense ratio is not an all-encompassing measure of the cost of ownership. Take, for example, index funds, which often rank near the bottom of their peers on expense ratio.
Index funds are designed to track or match the components of an index formed by an index provider, such as Russell or MSCI. Important decisions in the investment process, such as which securities to include in the index, are outsourced to an index provider and are not within the fund manager’s discretion. For example, the prescribed reconstitution schedule for an index, which is the process of deleting or adding certain stocks to the index, may cause index funds to buy stocks when buy demand is high and sell stocks when buy demand is low. This price-insensitive buying and selling may be required so that the index fund can stay true to its investment mandate of tracking an underlying index. This can result in suboptimal transaction prices for the index fund and diminished overall returns. In other words, for a given amount of trading (or turnover), the cost per unit of trading may be higher for such a strictly regimented approach to investing. Moreover, this cost will not appear explicitly to investors assessing such a fund on expense ratio alone. Further, because indices are reconstituted infrequently (typically once per year), funds seeking to track them may also be forced to buy and sell holdings based on stale eligibility criteria. For example, the characteristics of a stock considered a value stock¹ as of the last reconstitution date may change over time, but between reconstitution dates, those changes would not affect that stock’s inclusion or weighting in a value index. That means incoming cash flows to a value index fund could actually be used to purchase stocks that currently look more like growth stocks² and vice versa. Metaphorically, these managers’ attention may be more focused on the rear-view mirror than on the road ahead for investors.
For active approaches like stock picking, both the total amount of trading and the cost per trade may be high. If a manager trades excessively or inefficiently, costs like commissions and price impact from trading can eat away at returns. Viewed through the lens of our car analogy, this impact is like the toll on your vehicle from incessantly jamming the brakes or accelerating quickly. Subjecting the car to such treatment may result in added wear and tear and greater fuel consumption, increasing your total cost of ownership. Similarly, excessive trading can lead to negative tax consequences for a fund, which can increase the cost of ownership for investors holding funds in taxable accounts. Such trading costs can be reduced by avoiding unnecessary turnover and seeking to minimize the cost per trade.
In contrast to both highly regimented indexing and high-turnover active strategies, employing a flexible investment approach that reduces the need for immediacy, and thus enables opportunistic execution, is one way to potentially reduce implicit costs. Keeping turnover low, remaining flexible, and transacting only when the potential benefits of a trade outweigh the costs can help keep overall trading costs down and help reduce the total cost of ownership.
Conclusion
The total cost of ownership of a mutual fund can be difficult to assess and requires a thorough understanding of costs beyond what an expense ratio can tell investors on its own. We believe investors should look beyond any one cost metric and instead evaluate the total cost of ownership of an investment solution.
Source: Dimensional Fund Advisors LP.
There is no guarantee investment strategies will be successful. Diversification does not eliminate the risk of market loss. Mutual fund investment values will fluctuate and shares, when redeemed, may be worth more or less than original cost. The types of fees and expenses will vary based on investment vehicle. Investments are subject to risk including possible loss of principal.
All expressions of opinion are subject to change. This article is distributed for informational purposes, and it is not to be construed as an offer, solicitation, recommendation, or endorsement of any particular security, products, or services.
Categories
Categories
Read Our Latest Articles Here
Michelle Maton Named to AdvisorHub’s 250 RIAs to Watch in 2026
High-Net-Worth Estate Planning Strategy: Flexibility and Generational Alignment
Dementia and Financial Planning: Protecting Your Family Before Capacity Changes