 First Quarter 2017
Ever ridden in a car with worn-out shock absorbers? Every bump is jarring, every corner stomach-churning, and every red light an excuse to assume the brace position. Owning an undiversified portfolio can trigger similar reactions.
You can drive a car with a broken suspension system, but it will be an extremely uncomfortable ride and the vehicle will be much harder to control, particularly in difficult conditions. Throw in the risk of a breakdown or running off the road altogether, and there’s a real chance you may not reach your destination.
In the world of investment, a similarly bumpy and unpredictable ride can await those with concentrated and undiversified portfolios or those who constantly tinker with their allocation.
Of course, everyone feels in control when the surface is straight and smooth, but it’s harder to stay on the road during sudden turns and ups and downs in the market.
For that reason, the smart thing to do is to diversify, spreading your portfolio across different securities, sectors, and countries. That also means identifying the right mix of investments (e.g., stocks, bonds, real estate) that aligns with your risk tolerance.
Using this approach, your returns from year to year may not match the top performing portfolio, but neither are they likely to match the worst. More importantly, this is a ride you are likelier to stick with.
Here’s an example. Among developed markets, Denmark was number one in US dollar terms in 2015 with a return of more than 23%. But a big bet on that country the following year would have backfired, as Denmark slid to bottom of the table with a loss of nearly 16%.1
It’s true that the US stock market (by far the world’s biggest) has been a strong performer in recent years. But a decade before, in 2004 and 2006, it was the second worst-performing developed market in the world.1
Predicting which part of a market will do best over a given period is tough. US small cap stocks were among the top performers in 2016 with a return of more than 21%. A year before, their results looked relatively disappointing with a loss of more than 4%. International small cap stocks had their turn in the sun in 2015, topping the performance tables with a return of just below 6%. But the year before that, they were the second worst with a loss of 5%.2
If you’ve ever taken a long road trip, you’ll know that conditions along the way can change quickly and unpredictably, which is why you need a vehicle that’s ready for the worst roads as well as the best. While diversification can never completely eliminate the impact of bumps along your particular investment road, it does help reduce the potential outsized impact that any individual investment can have on your journey.
With sufficient diversification, the jarring effects of performance extremes level out. That, in turn, helps you stay in your chosen lane and on the road to your investment destination.
Happy motoring and happy investing.
Market Summary
Index Returns
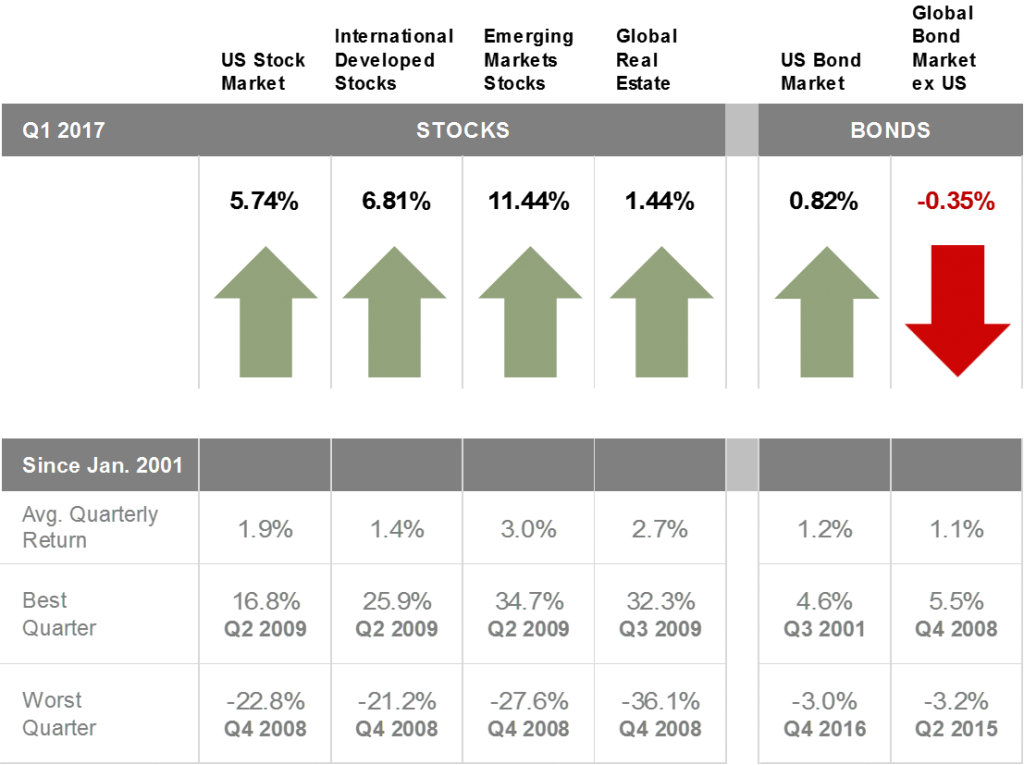 Past performance is not a guarantee of future results. Indices are not available for direct investment. Index performance does not reflect the expenses associated with the management of an actual portfolio. Market segment (index representation) as follows: US Stock Market (Russell 3000 Index), International Developed Stocks (MSCI World ex USA Index [net div.]), Emerging Markets (MSCI Emerging Markets Index [net div.]), Global Real Estate (S&P Global REIT Index [net div.]), US Bond Market (Bloomberg Barclays US Aggregate Bond Index), and Global Bond ex US Market (Citi WGBI ex USA 1−30 Years [Hedged to USD]). The S&P data are provided by Standard & Poor’s Index Services Group. Frank Russell Company is the source and owner of the trademarks, service marks, and copyrights related to the Russell Indexes. MSCI data © MSCI 2017, all rights reserved. Bloomberg Barclays data provided by Bloomberg. Citi fixed income indices copyright 2017 by Citigroup.
World Stock Market Performance
MSCI All Country World Index with selected headlines from Q1 2017
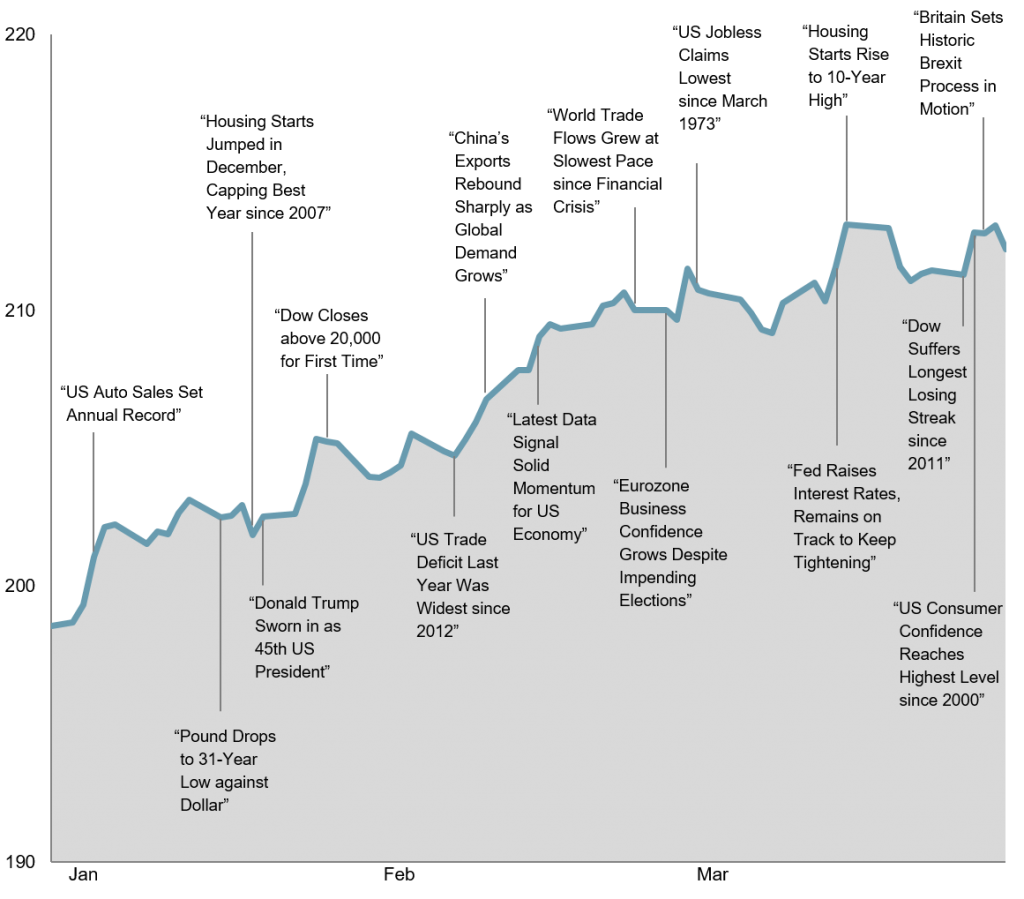
These headlines are not offered to explain market returns. Instead, they serve as a reminder that investors should view daily events from a long-term perspective and avoid making investment decisions based solely on the news.
Graph Source: MSCI ACWI Index [net div.]. MSCI data © MSCI 2017, all rights reserved. It is not possible to invest directly in an index. Performance does not reflect the expenses associated with management of an actual portfolio. Past performance is not a guarantee of future results.
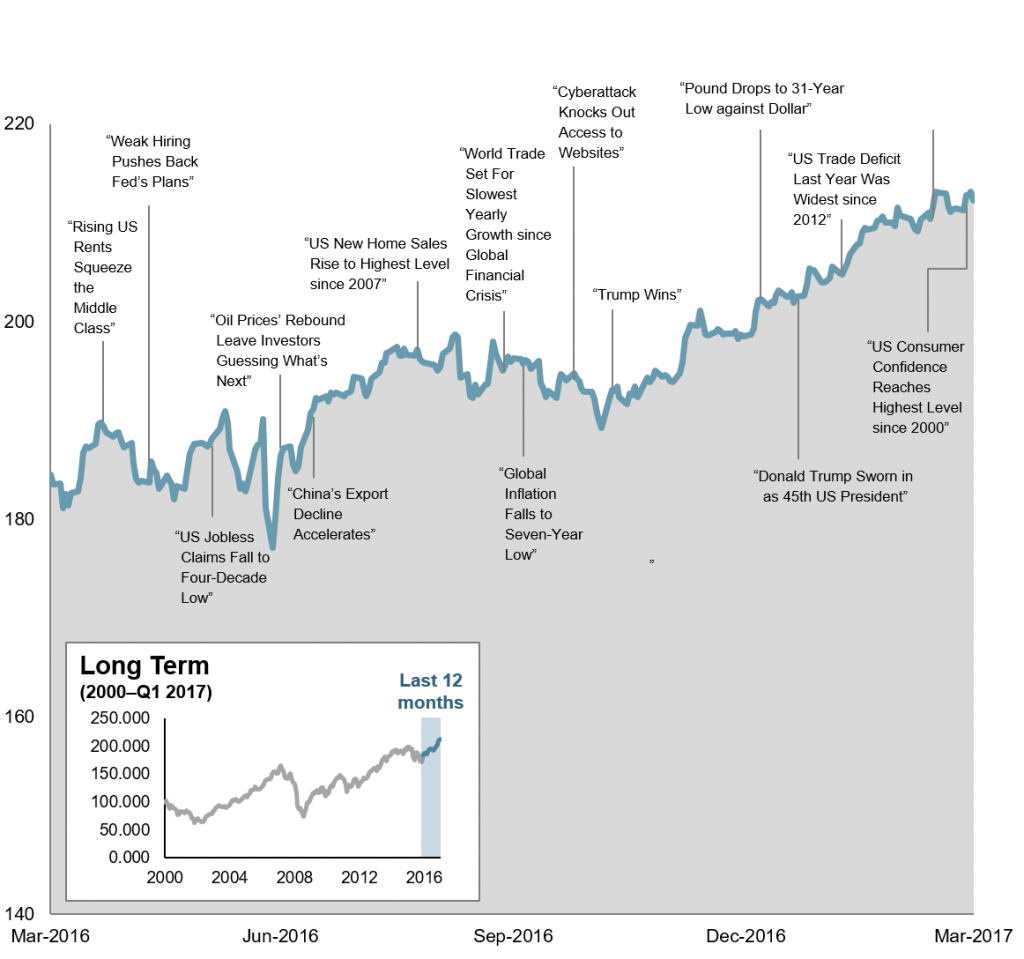
World Stock Market Performance
MSCI All Country World Index with selected headlines from past 12 months
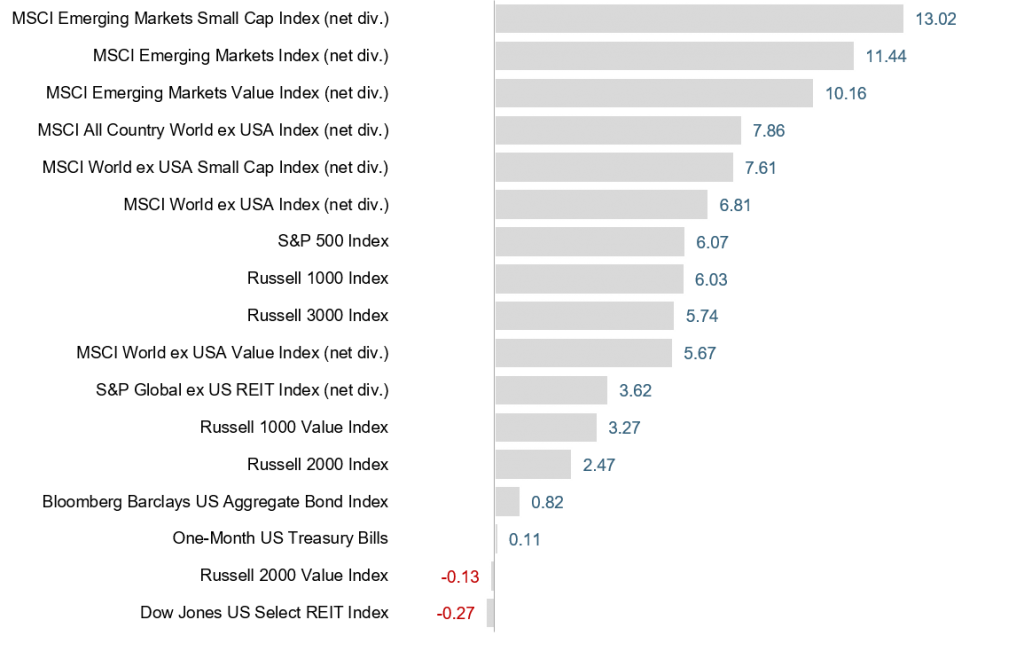
World Asset Classes
First Quarter 2017 Index Returns (%)
Looking at broad market indices, emerging markets outperformed both US and non-US developed markets during the quarter. Real estate investment trusts (REITs) lagged their equity market counterparts.
The value effect was negative in the US, non-US, and emerging markets. Small caps outperformed large caps in emerging markets and non-US developed markets but underperformed in the US.
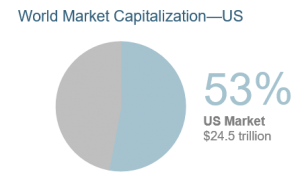
US Stocks
First Quarter 2017 Index Returns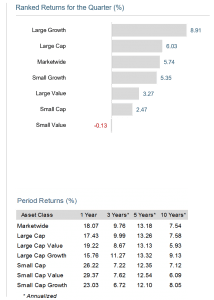
The broad US equity market recorded positive absolute performance for the quarter.
Value underperformed growth indices across all size ranges.
Small caps underperformed large caps.
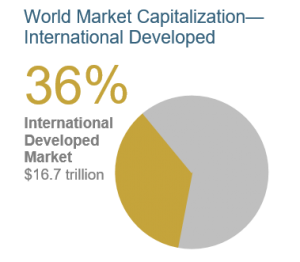
International Developed Stocks
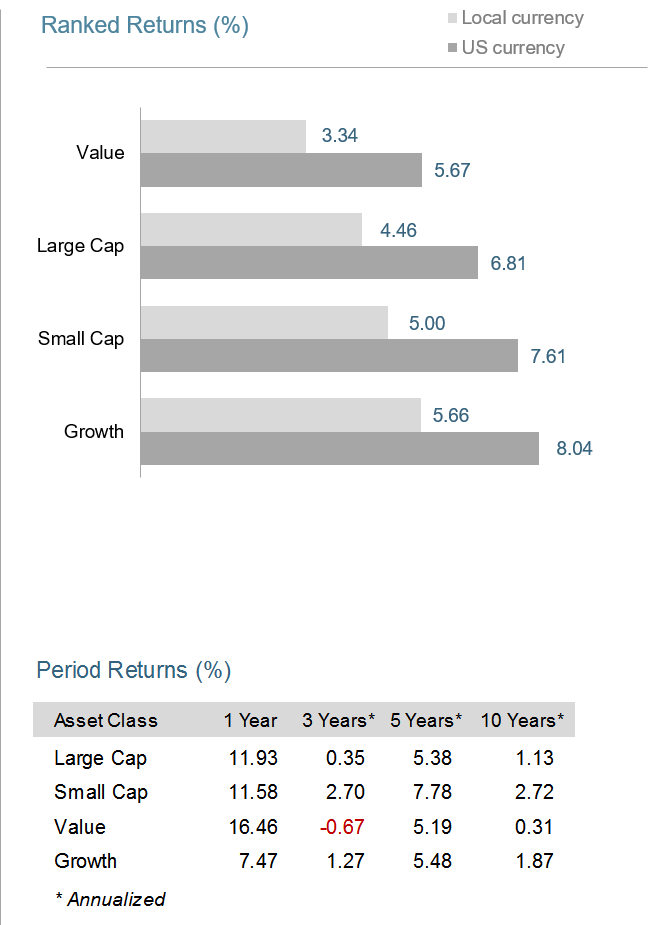 First Quarter 2017 Index Returns
In US dollar terms, developed markets outperformed the US equity market but underperformed emerging markets indices during the quarter.
Small caps outperformed large caps in non-US developed markets.
The value effect was negative across all size ranges in non-US developed markets.
Emerging Markets Stocks
First Quarter 2017 Index Returns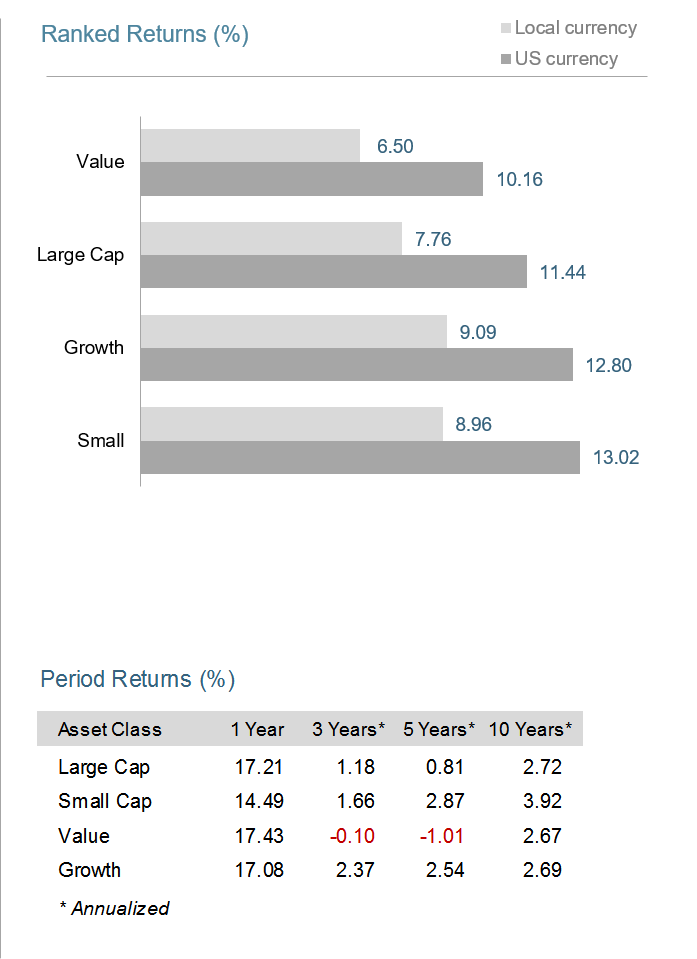
In US dollar terms, emerging markets indices outperformed both the US and developed markets outside the US.
The value effect was negative among large cap stocks in emerging markets but positive among small cap stocks.
Small caps outperformed large caps.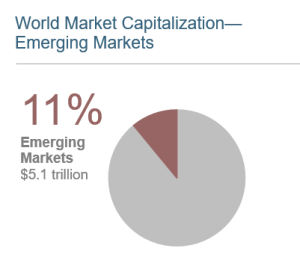
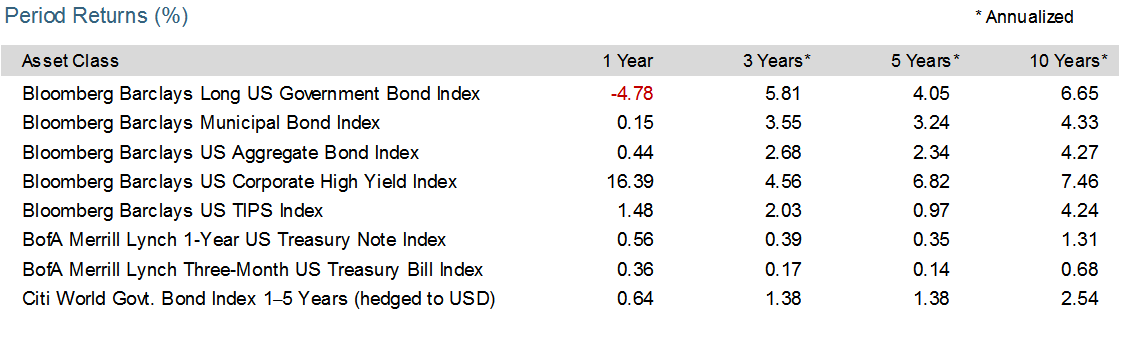
Fixed Income
First Quarter 2017 Index Return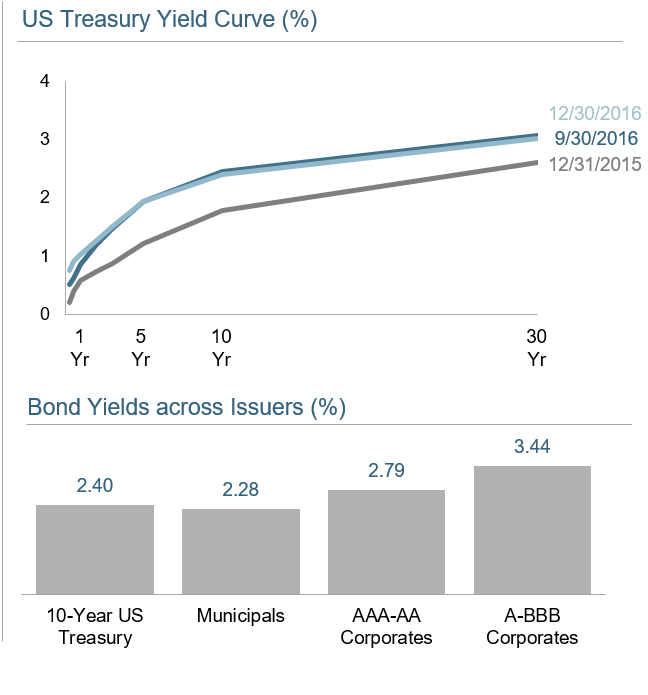
Interest rates were mixed across the US fixed income market during the first quarter of 2017. The yield on the 5-year Treasury note was unchanged, ending at 1.93%. The yield on the 10-year Treasury note decreased 5 basis points (bps) to 2.40%. The 30-year Treasury bond yield decreased 4 bps to 3.02%.
The yield on the 1-year Treasury bill rose 18 bps to 1.03%, and the 2-year T-note yield increased 7 bps to 1.27%. The yield on the 3-month T-bill increased 25 bps to 0.76%, while the 6-month T-bill yield rose 29 bps to 0.91%.
Looking at total returns, short-term corporate bonds gained 0.69% and intermediate-term corporate bonds gained 1.16%.
Short-term municipal bonds generated a total return of 1.20%, while intermediate-term municipal bonds returned 1.91%. Revenue bonds performed in line with general obligation bonds.
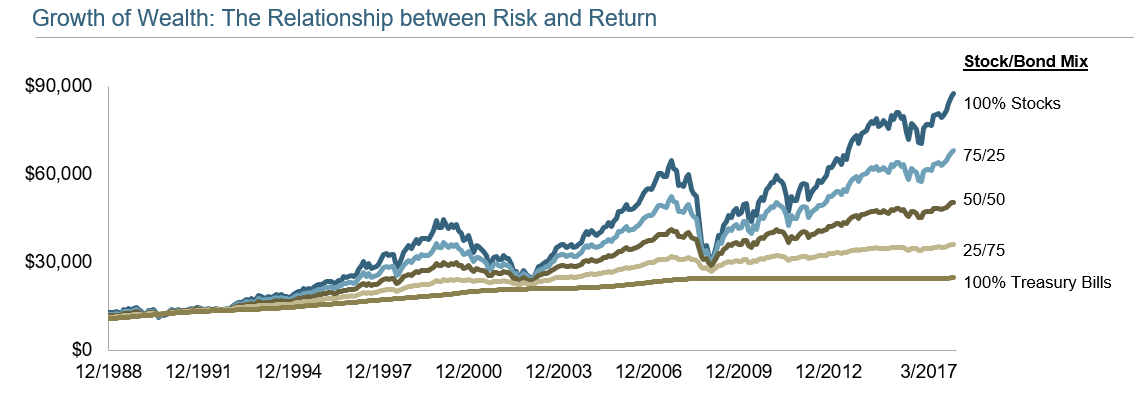
Global Diversification
First Quarter 2017 Index Return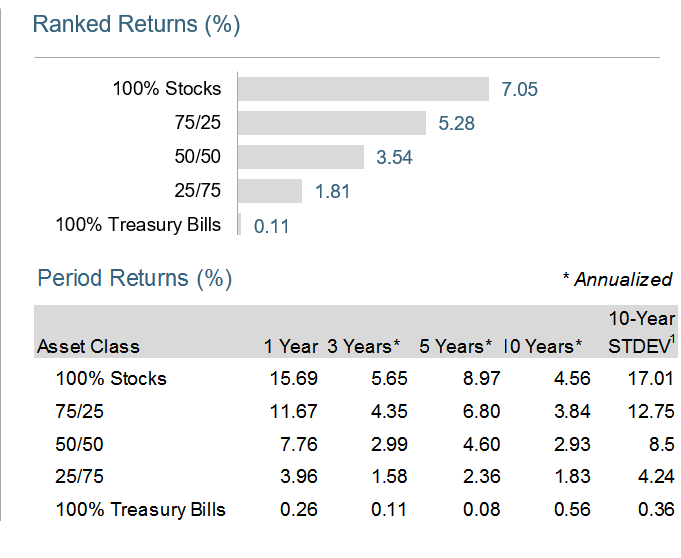
These portfolios illustrate the performance of different global stock/bond mixes and highlight the benefits of diversification. Mixes with larger allocations to stocks are considered riskier but have higher expected returns over time.
1. In US dollars MSCI developed markets country indices (net dividends). MSCI data © MSCI 2017, all rights reserved.
2. In US Dollars. US Small Cap is the Russell 2000 Index. Frank Russell Company is the source and owner of the trademarks, service marks, and copyrights related ot the Russell Indexes. International Small Cap is the MSCI World ex USA Small Cap Index (gross dividends). MSCI data copyright MSCI 2017, all rights reserved.
Adapted from “Investment Shock Absorbers,” Outside the Flags, February 2017. Dimensional Fund Advisors LP is an investment advisor registered with the Securities and Exchange Commission. All expressions of opinion are subject to change. This information is intended for educational purposes, and it is not to be construed as an offer, soliciation, recommendation, or endorsement of any particular security, products, or services. Performance does not reflect the expenses associated with management of an actual portfolio. Past performance is not a guarantee of future results.
Investment Shock Absorbers – Quarterly Market Review
Ever ridden in a car with worn-out shock absorbers? Every bump is jarring, every corner stomach-churning, and every red light an excuse to assume the brace position. Owning an undiversified portfolio can trigger similar reactions.
You can drive a car with a broken suspension system, but it will be an extremely uncomfortable ride and the vehicle will be much harder to control, particularly in difficult conditions. Throw in the risk of a breakdown or running off the road altogether, and there’s a real chance you may not reach your destination.
In the world of investment, a similarly bumpy and unpredictable ride can await those with concentrated and undiversified portfolios or those who constantly tinker with their allocation.
Of course, everyone feels in control when the surface is straight and smooth, but it’s harder to stay on the road during sudden turns and ups and downs in the market.
For that reason, the smart thing to do is to diversify, spreading your portfolio across different securities, sectors, and countries. That also means identifying the right mix of investments (e.g., stocks, bonds, real estate) that aligns with your risk tolerance.
Using this approach, your returns from year to year may not match the top performing portfolio, but neither are they likely to match the worst. More importantly, this is a ride you are likelier to stick with.
Here’s an example. Among developed markets, Denmark was number one in US dollar terms in 2015 with a return of more than 23%. But a big bet on that country the following year would have backfired, as Denmark slid to bottom of the table with a loss of nearly 16%.1
It’s true that the US stock market (by far the world’s biggest) has been a strong performer in recent years. But a decade before, in 2004 and 2006, it was the second worst-performing developed market in the world.1
Predicting which part of a market will do best over a given period is tough. US small cap stocks were among the top performers in 2016 with a return of more than 21%. A year before, their results looked relatively disappointing with a loss of more than 4%. International small cap stocks had their turn in the sun in 2015, topping the performance tables with a return of just below 6%. But the year before that, they were the second worst with a loss of 5%.2
If you’ve ever taken a long road trip, you’ll know that conditions along the way can change quickly and unpredictably, which is why you need a vehicle that’s ready for the worst roads as well as the best. While diversification can never completely eliminate the impact of bumps along your particular investment road, it does help reduce the potential outsized impact that any individual investment can have on your journey.
With sufficient diversification, the jarring effects of performance extremes level out. That, in turn, helps you stay in your chosen lane and on the road to your investment destination.
Happy motoring and happy investing.
Market Summary
Index Returns
World Stock Market Performance
MSCI All Country World Index with selected headlines from Q1 2017
These headlines are not offered to explain market returns. Instead, they serve as a reminder that investors should view daily events from a long-term perspective and avoid making investment decisions based solely on the news.
Graph Source: MSCI ACWI Index [net div.]. MSCI data © MSCI 2017, all rights reserved. It is not possible to invest directly in an index. Performance does not reflect the expenses associated with management of an actual portfolio. Past performance is not a guarantee of future results.
World Stock Market Performance
MSCI All Country World Index with selected headlines from past 12 months
World Asset Classes
First Quarter 2017 Index Returns (%)
Looking at broad market indices, emerging markets outperformed both US and non-US developed markets during the quarter. Real estate investment trusts (REITs) lagged their equity market counterparts.
The value effect was negative in the US, non-US, and emerging markets. Small caps outperformed large caps in emerging markets and non-US developed markets but underperformed in the US.
US Stocks
First Quarter 2017 Index Returns
The broad US equity market recorded positive absolute performance for the quarter.
Value underperformed growth indices across all size ranges.
Small caps underperformed large caps.
International Developed Stocks
In US dollar terms, developed markets outperformed the US equity market but underperformed emerging markets indices during the quarter.
Small caps outperformed large caps in non-US developed markets.
The value effect was negative across all size ranges in non-US developed markets.
Emerging Markets Stocks
First Quarter 2017 Index Returns
In US dollar terms, emerging markets indices outperformed both the US and developed markets outside the US.
The value effect was negative among large cap stocks in emerging markets but positive among small cap stocks.
Small caps outperformed large caps.
Fixed Income
First Quarter 2017 Index Return
Interest rates were mixed across the US fixed income market during the first quarter of 2017. The yield on the 5-year Treasury note was unchanged, ending at 1.93%. The yield on the 10-year Treasury note decreased 5 basis points (bps) to 2.40%. The 30-year Treasury bond yield decreased 4 bps to 3.02%.
The yield on the 1-year Treasury bill rose 18 bps to 1.03%, and the 2-year T-note yield increased 7 bps to 1.27%. The yield on the 3-month T-bill increased 25 bps to 0.76%, while the 6-month T-bill yield rose 29 bps to 0.91%.
Looking at total returns, short-term corporate bonds gained 0.69% and intermediate-term corporate bonds gained 1.16%.
Short-term municipal bonds generated a total return of 1.20%, while intermediate-term municipal bonds returned 1.91%. Revenue bonds performed in line with general obligation bonds.
Global Diversification
First Quarter 2017 Index Return
These portfolios illustrate the performance of different global stock/bond mixes and highlight the benefits of diversification. Mixes with larger allocations to stocks are considered riskier but have higher expected returns over time.
1. In US dollars MSCI developed markets country indices (net dividends). MSCI data © MSCI 2017, all rights reserved.
2. In US Dollars. US Small Cap is the Russell 2000 Index. Frank Russell Company is the source and owner of the trademarks, service marks, and copyrights related ot the Russell Indexes. International Small Cap is the MSCI World ex USA Small Cap Index (gross dividends). MSCI data copyright MSCI 2017, all rights reserved.
Adapted from “Investment Shock Absorbers,” Outside the Flags, February 2017. Dimensional Fund Advisors LP is an investment advisor registered with the Securities and Exchange Commission. All expressions of opinion are subject to change. This information is intended for educational purposes, and it is not to be construed as an offer, soliciation, recommendation, or endorsement of any particular security, products, or services. Performance does not reflect the expenses associated with management of an actual portfolio. Past performance is not a guarantee of future results.
Categories
Categories
Read Our Latest Articles Here
Dementia and Financial Planning: Protecting Your Family Before Capacity Changes
Michelle Maton Named to InvestmentNews $100M Club: Top Female Advisors 2026
Life Insurance in Midlife: Do You Still Need It and How Much Is Enough?