This report features world capital market performance and a timeline of events for the past quarter. It begins with a global overview, then features the returns of stock and bond asset classes in the US and international markets. The report also illustrates the impact of globally diversified portfolios.
Market Summary
Index Returns
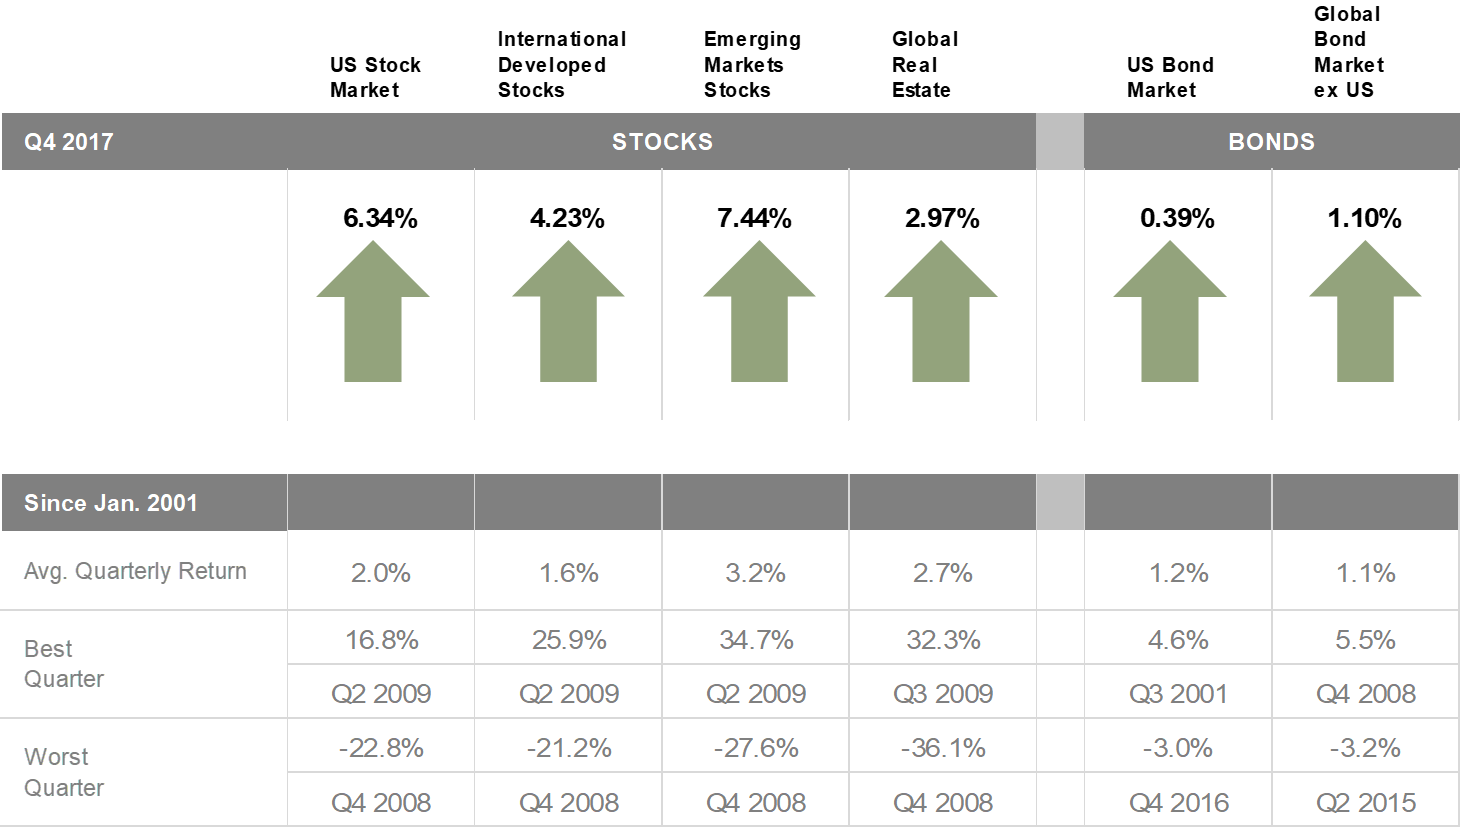 Past performance is not a guarantee of future results. Indices are not available for direct investment. Index performance does not reflect the expenses associated with the management of an actual portfolio. Market segment (index representation) as follows: US Stock Market (Russell 3000 Index), International Developed Stocks (MSCI World ex USA Index [net div.]), Emerging Markets (MSCI Emerging Markets Index [net div.]), Global Real Estate (S&P Global REIT Index [net div.]), US Bond Market (Bloomberg Barclays US Aggregate Bond Index), and Global Bond ex US Market (Citi WGBI ex USA 1−30 Years [Hedged to USD]). The S&P data are provided by Standard & Poor’s Index Services Group. Frank Russell Company is the source and owner of the trademarks, service marks, and copyrights related to the Russell Indexes. MSCI data © MSCI 2017, all rights reserved. Bloomberg Barclays data provided by Bloomberg. Citi fixed income indices copyright 2017 by Citigroup.
World Stock Market Performance
MSCI All Country World Index with selected headlines from Q4 2017
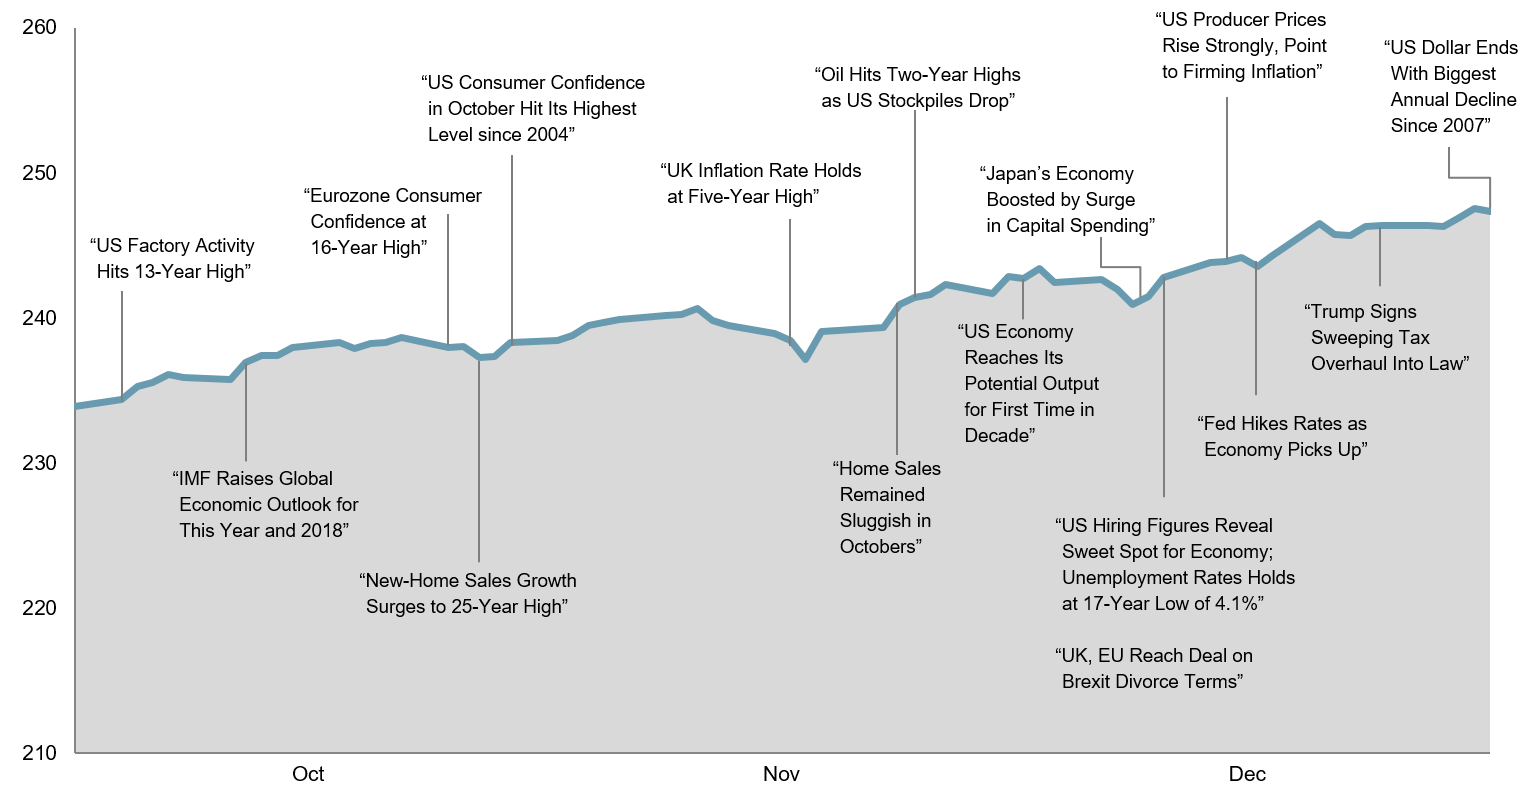
These headlines are not offered to explain market returns. Instead, they serve as a reminder that investors should view daily events from a long-term perspective and avoid making investment decisions based solely on the news.
Graph Source: MSCI ACWI Index [net div.]. MSCI data © MSCI 2017, all rights reserved. It is not possible to invest directly in an index. Performance does not reflect the expenses associated with management of an actual portfolio. Past performance is not a guarantee of future results.
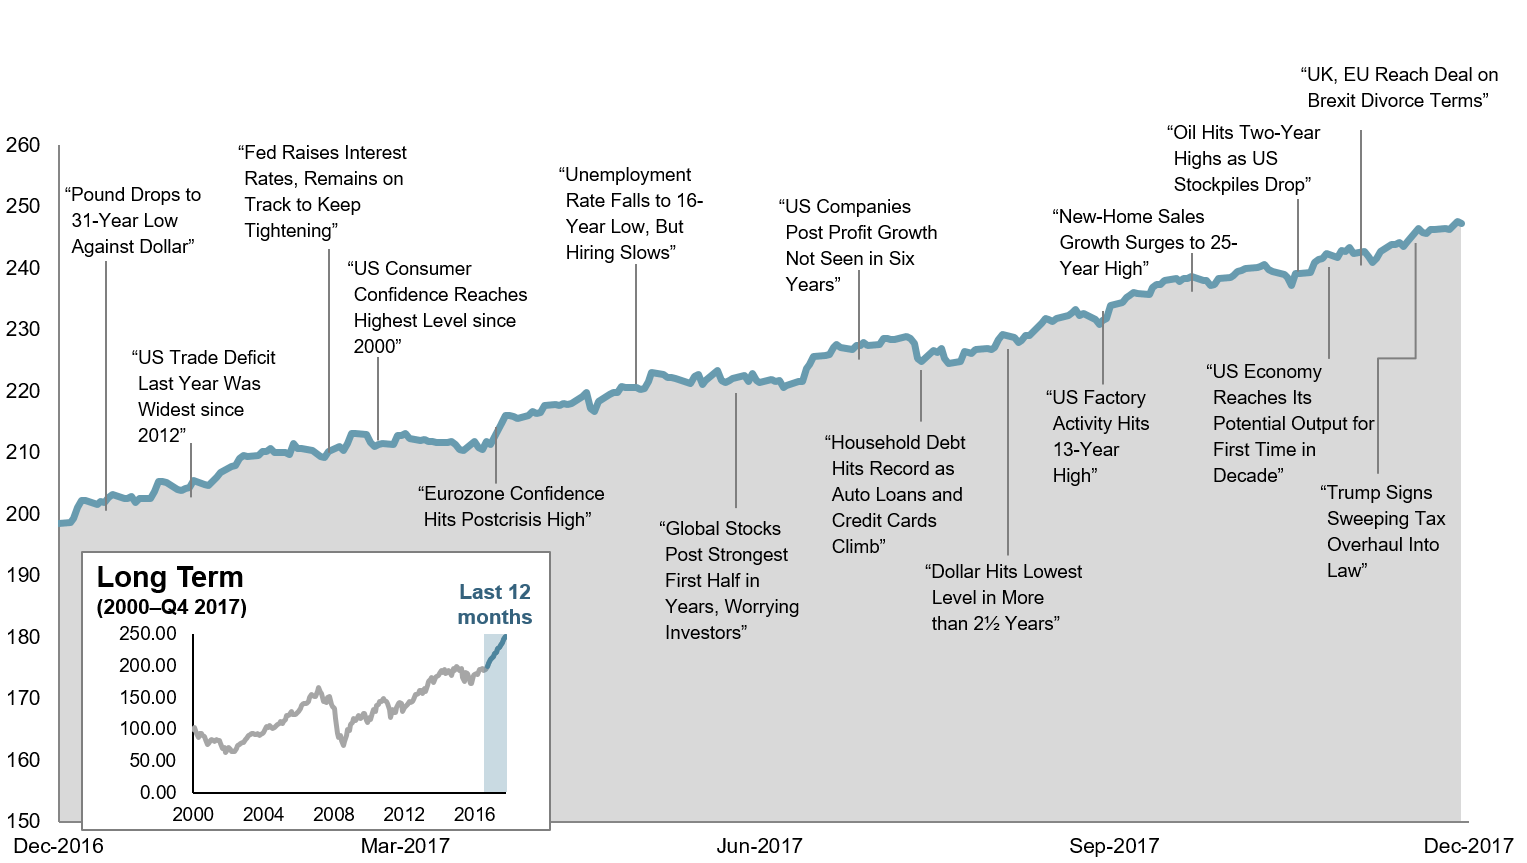
World Stock Market Performance
MSCI All Country World Index with selected headlines from past 12 months
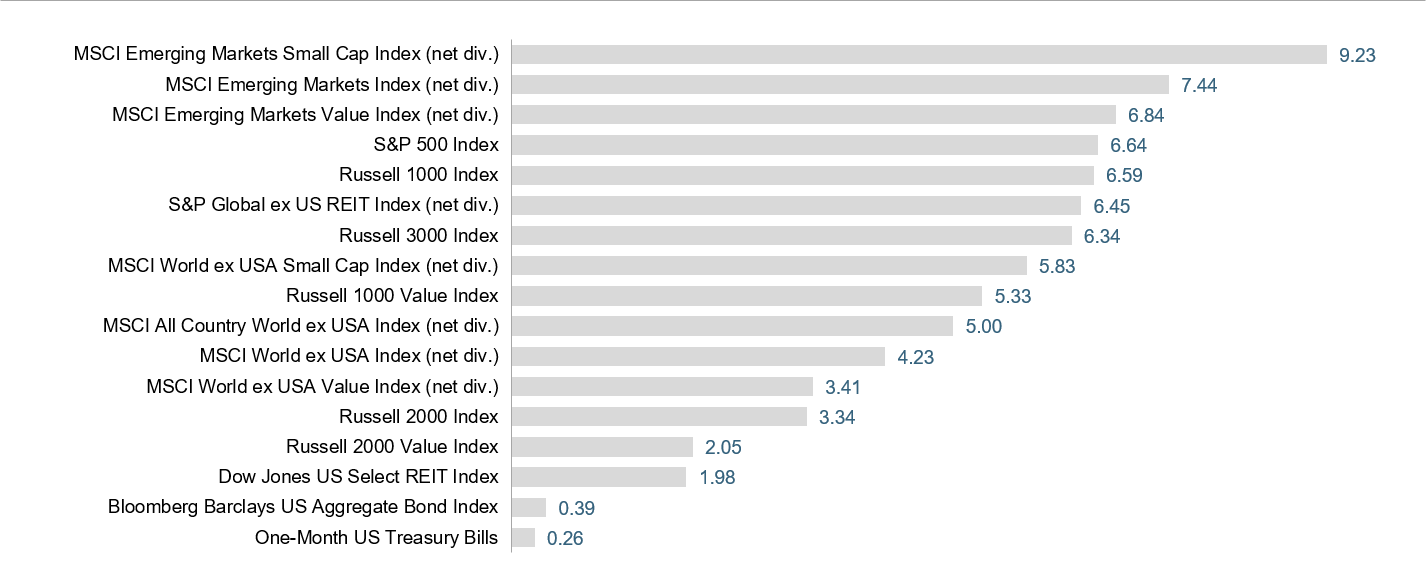
World Asset Classes
Fourth Quarter 2017 Index Returns (%)
Looking at broad market indices, emerging markets outperformed US and non-US developed markets during the quarter.
The value effect was negative in the US, non-US developed markets, and emerging markets. Small caps outperformed large caps in non-US developed markets and emerging markets but underperformed in the US.
US Stocks
Fourth Quarter 2017 Index Returns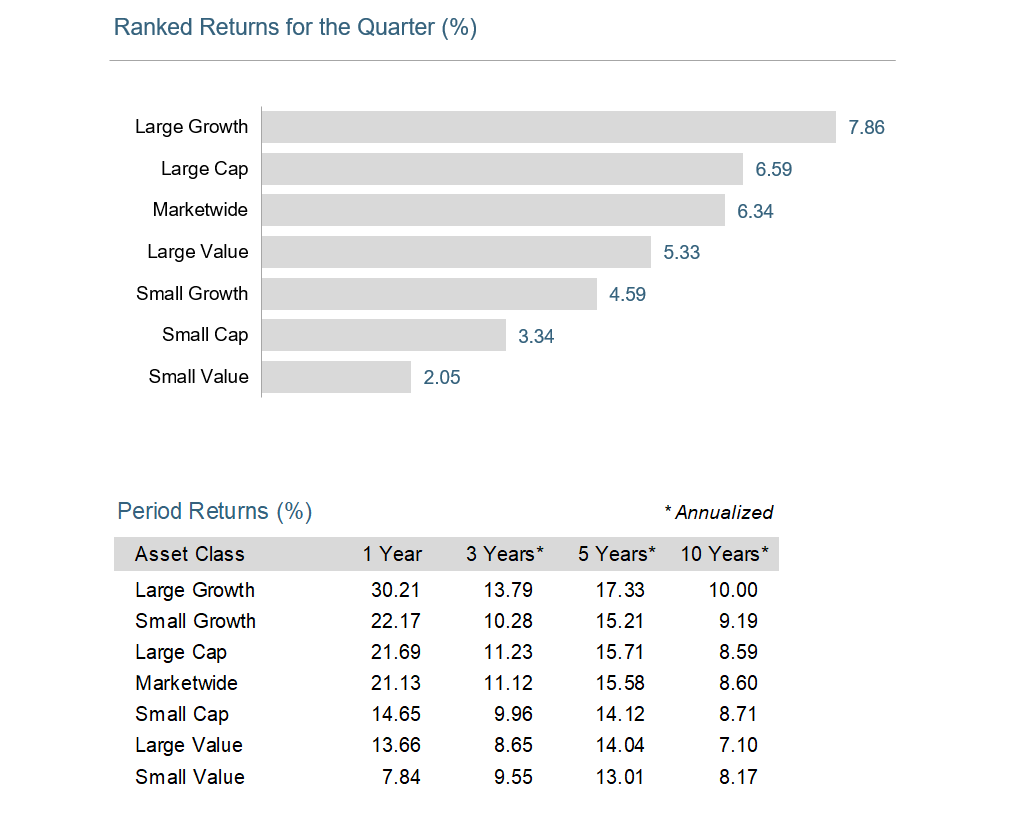
The US equity market posted a positive return for the quarter, outperforming non-US developed markets but underperforming emerging markets.
Value underperformed growth in the US across large and small cap indices.
Overall, small caps in the US underperformed large caps.
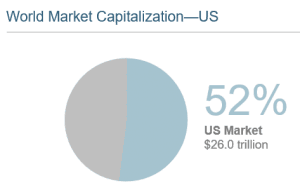
International Developed Stocks
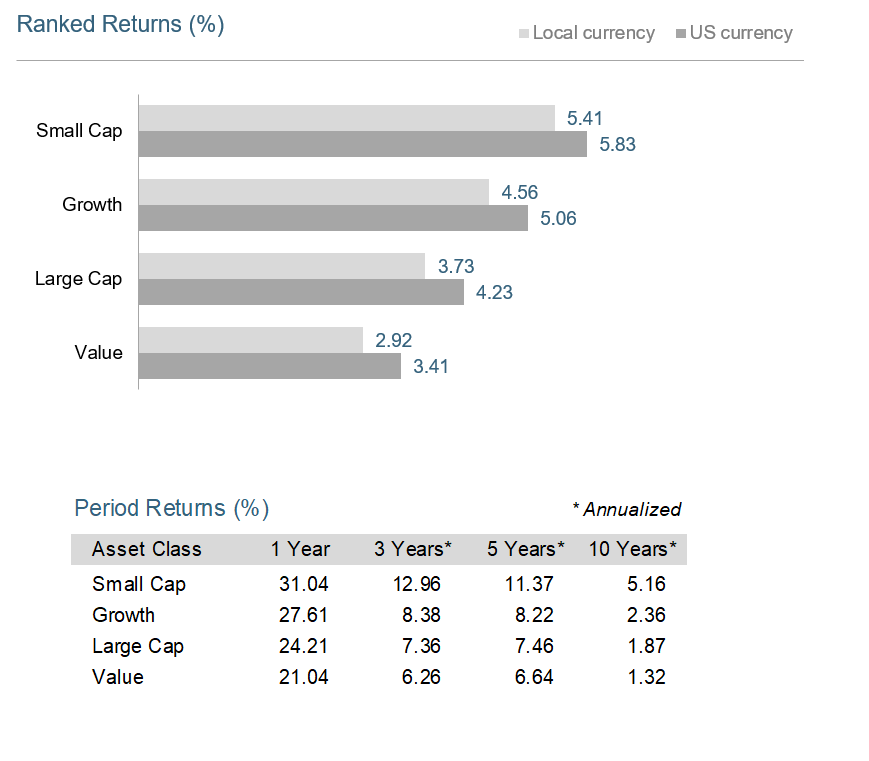 Fourth Quarter 2017 Index Returns
In US dollar terms, developed markets underperformed the US and emerging markets during the quarter.
Looking at market indices, the value effect was negative.
Small caps outperformed large caps in non-US developed markets.
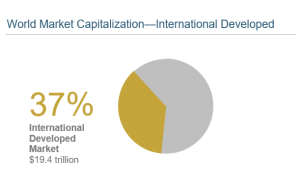
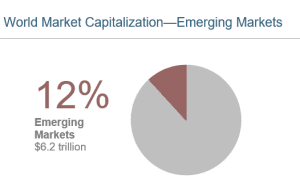
Emerging Markets Stocks
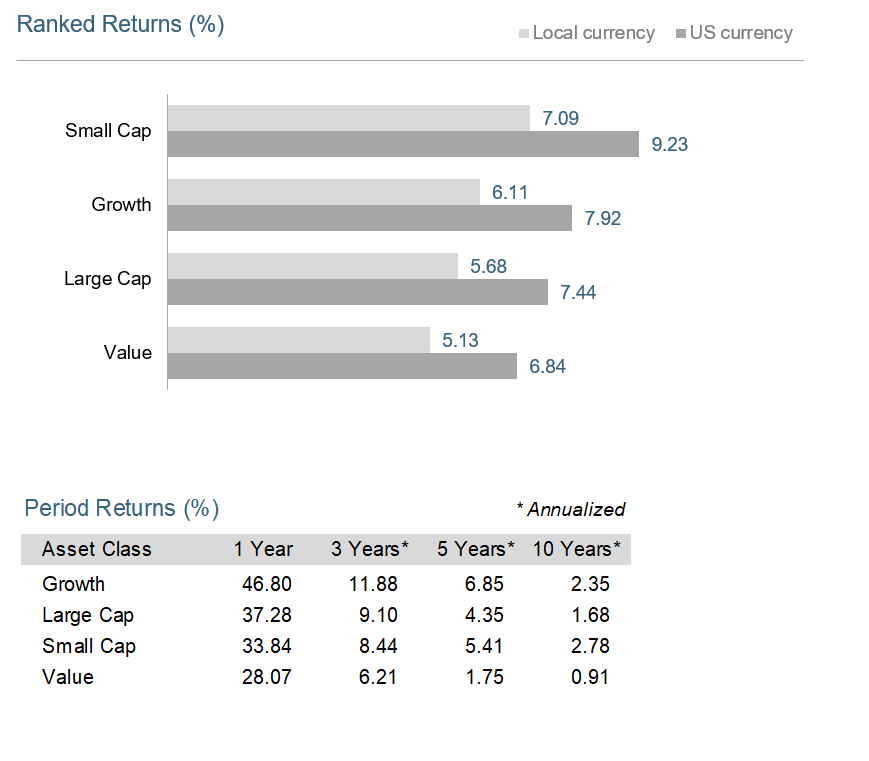 Fourth Quarter 2017 Index Returns
In US dollar terms, emerging markets outperformed the US and non-US developed markets during the quarter.
Looking at broad market indices, the value effect was negative.
Small caps outperformed large caps in emerging markets.
.
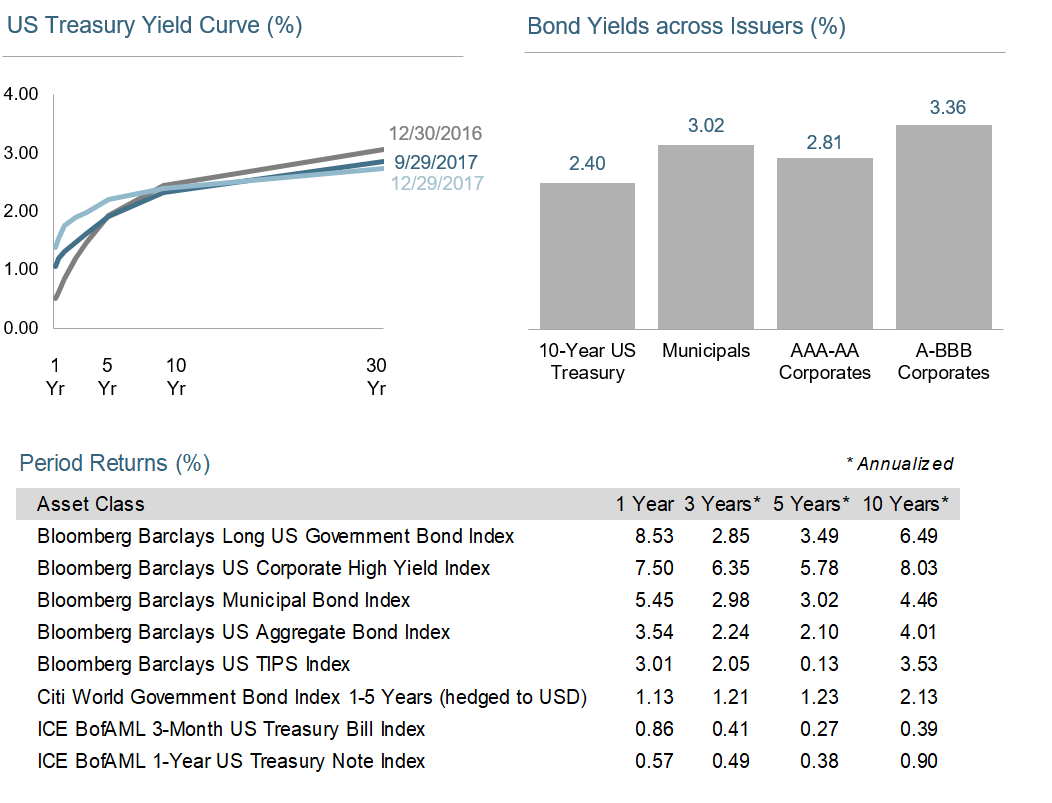
Fixed Income
Fourth Quarter 2017 Index Return
Interest rate changes across the US fixed income market were mixed during the fourth quarter. The yield on the 5-year Treasury note rose 28 basis points (bps), ending at 2.20%. The yield on the 10-year Treasury note increased 7 bps to 2.40%. The 30-year Treasury bond yield decreased 12 bps to finish at 2.74%.
In terms of total returns, short-term corporate bonds declined 0.04% during the quarter but increased 1.85% for the year. Intermediate-term corporate bonds gained 0.17% for the quarter and 3.92% for the year.
The total returns for short-term municipal bonds were –0.65% for the quarter and 1.61% for the year. Intermediate-term municipal bonds fell 0.09% for the quarter but gained 4.70% for the year. Revenue bonds outperformed general obligation bonds for the year.
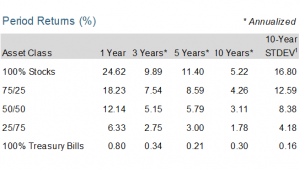
Impact of Diversification
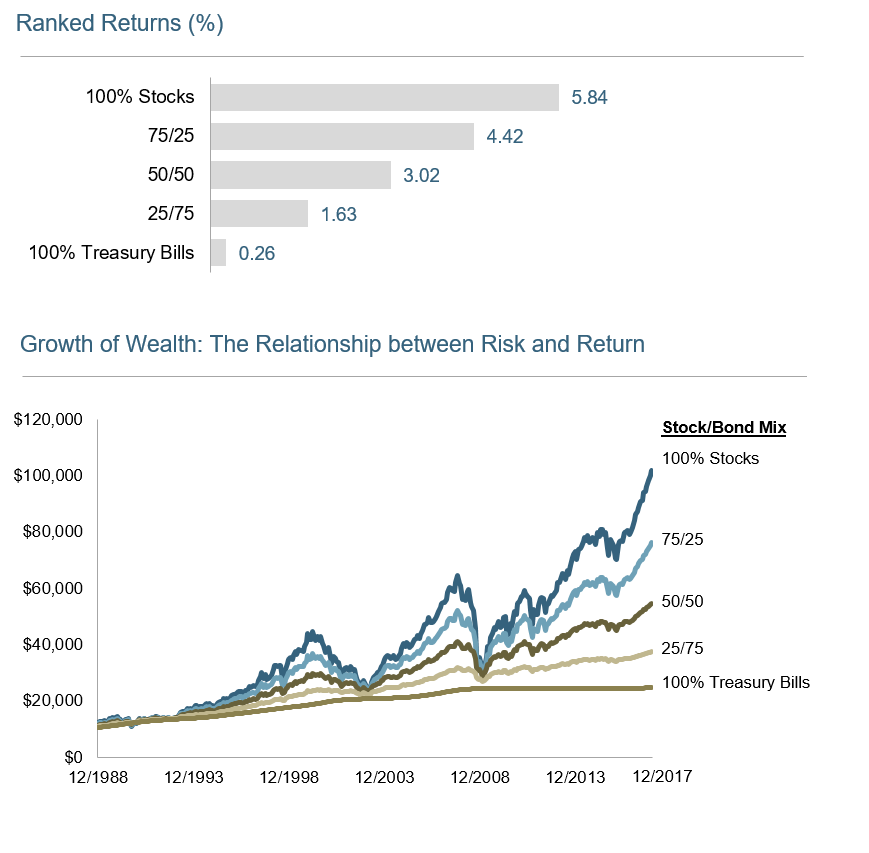 Fourth Quarter 2017 Index Return
These portfolios illustrate the performance of different global stock/bond mixes. Mixes with larger allocations to stocks are considered riskier but have higher expected returns over time.
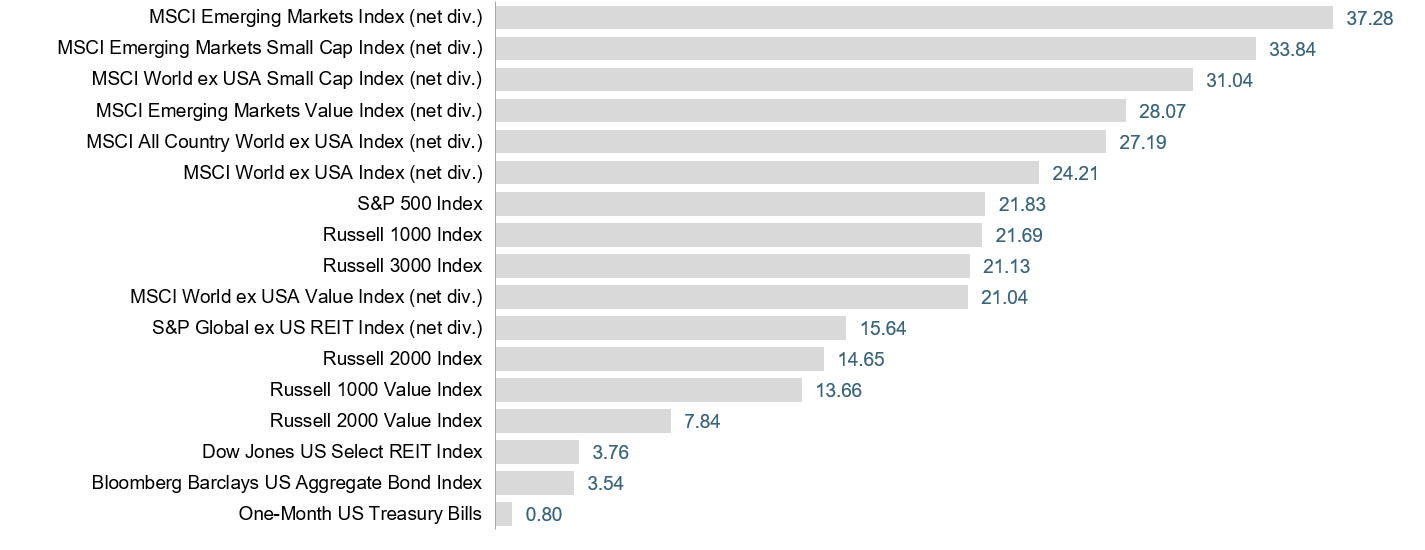
Market Summary – 2017
Index Returns
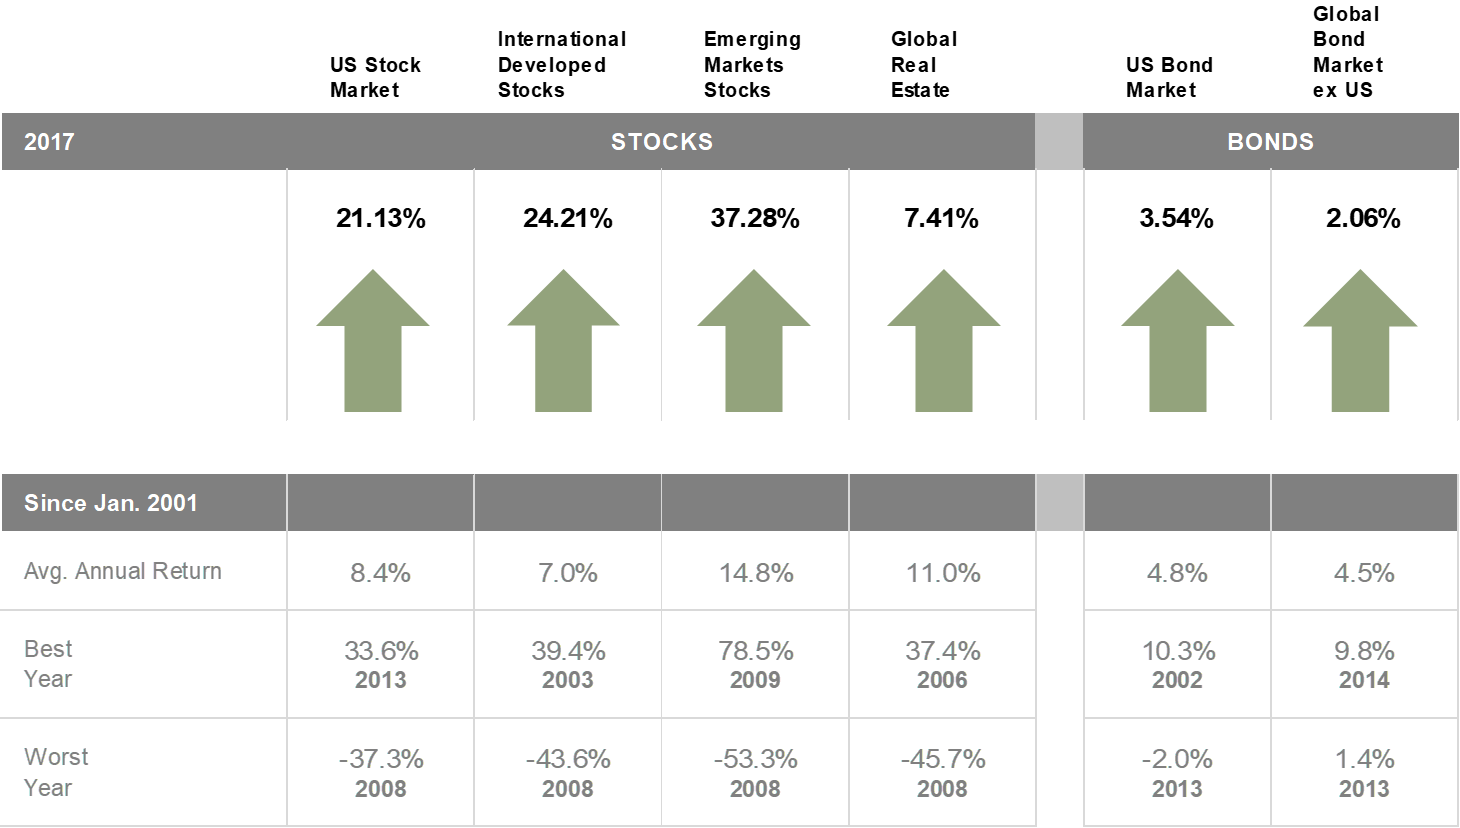
World Asset Classes
2017 Index Returns (%)
Looking at broad market indices, emerging markets outperformed US and non-US developed markets in 2017.
The value effect was negative in the US, non-US developed markets, and emerging markets. Small caps outperformed large caps in non-US developed markets but underperformed in the US and emerging markets.
Past performance is not a guarantee of future results. Indices are not available for direct investment. Index performance does not reflect the expenses associated with the management of an actual portfolio.
The S&P data is provided by Standard & Poor’s Index Services Group. Frank Russell Company is the source and owner of the trademarks, service marks, and copyrights related to the Russell Indexes. MSCI data © MSCI 2018, all rights reserved. Dow Jones data (formerly Dow Jones Wilshire) provided by Dow Jones Indices. Bloomberg Barclays data provided by Bloomberg. Treasury bills © Stocks, Bonds, Bills, and Inflation Yearbook™, Ibbotson Associates, Chicago (annually updated work by Roger G. Ibbotson and Rex A. Sinquefield).
1. In US dollars MSCI developed markets country indices (net dividends). MSCI data © MSCI 2017, all rights reserved.
2. In US Dollars. US Small Cap is the Russell 2000 Index. Frank Russell Company is the source and owner of the trademarks, service marks, and copyrights related ot the Russell Indexes. International Small Cap is the MSCI World ex USA Small Cap Index (gross dividends). MSCI data copyright MSCI 2017, all rights reserved.
Adapted from “Investment Shock Absorbers,” Outside the Flags, February 2017. Dimensional Fund Advisors LP is an investment advisor registered with the Securities and Exchange Commission. All expressions of opinion are subject to change. This information is intended for educational purposes, and it is not to be construed as an offer, soliciation, recommendation, or endorsement of any particular security, products, or services. Performance does not reflect the expenses associated with management of an actual portfolio. Past performance is not a guarantee of future results.
Quarterly Market Review – Q4 2017
This report features world capital market performance and a timeline of events for the past quarter. It begins with a global overview, then features the returns of stock and bond asset classes in the US and international markets. The report also illustrates the impact of globally diversified portfolios.
Market Summary
Index Returns
World Stock Market Performance
MSCI All Country World Index with selected headlines from Q4 2017
These headlines are not offered to explain market returns. Instead, they serve as a reminder that investors should view daily events from a long-term perspective and avoid making investment decisions based solely on the news.
Graph Source: MSCI ACWI Index [net div.]. MSCI data © MSCI 2017, all rights reserved. It is not possible to invest directly in an index. Performance does not reflect the expenses associated with management of an actual portfolio. Past performance is not a guarantee of future results.
World Stock Market Performance
MSCI All Country World Index with selected headlines from past 12 months
World Asset Classes
Fourth Quarter 2017 Index Returns (%)
Looking at broad market indices, emerging markets outperformed US and non-US developed markets during the quarter.
The value effect was negative in the US, non-US developed markets, and emerging markets. Small caps outperformed large caps in non-US developed markets and emerging markets but underperformed in the US.
US Stocks
Fourth Quarter 2017 Index Returns
The US equity market posted a positive return for the quarter, outperforming non-US developed markets but underperforming emerging markets.
Value underperformed growth in the US across large and small cap indices.
Overall, small caps in the US underperformed large caps.
International Developed Stocks
In US dollar terms, developed markets underperformed the US and emerging markets during the quarter.
Looking at market indices, the value effect was negative.
Small caps outperformed large caps in non-US developed markets.
Emerging Markets Stocks
In US dollar terms, emerging markets outperformed the US and non-US developed markets during the quarter.
Looking at broad market indices, the value effect was negative.
Small caps outperformed large caps in emerging markets.
.
Fixed Income
Fourth Quarter 2017 Index Return
Interest rate changes across the US fixed income market were mixed during the fourth quarter. The yield on the 5-year Treasury note rose 28 basis points (bps), ending at 2.20%. The yield on the 10-year Treasury note increased 7 bps to 2.40%. The 30-year Treasury bond yield decreased 12 bps to finish at 2.74%.
In terms of total returns, short-term corporate bonds declined 0.04% during the quarter but increased 1.85% for the year. Intermediate-term corporate bonds gained 0.17% for the quarter and 3.92% for the year.
The total returns for short-term municipal bonds were –0.65% for the quarter and 1.61% for the year. Intermediate-term municipal bonds fell 0.09% for the quarter but gained 4.70% for the year. Revenue bonds outperformed general obligation bonds for the year.
Impact of Diversification
These portfolios illustrate the performance of different global stock/bond mixes. Mixes with larger allocations to stocks are considered riskier but have higher expected returns over time.
Market Summary – 2017
Index Returns
World Asset Classes
2017 Index Returns (%)
Looking at broad market indices, emerging markets outperformed US and non-US developed markets in 2017.
The value effect was negative in the US, non-US developed markets, and emerging markets. Small caps outperformed large caps in non-US developed markets but underperformed in the US and emerging markets.
Past performance is not a guarantee of future results. Indices are not available for direct investment. Index performance does not reflect the expenses associated with the management of an actual portfolio.
The S&P data is provided by Standard & Poor’s Index Services Group. Frank Russell Company is the source and owner of the trademarks, service marks, and copyrights related to the Russell Indexes. MSCI data © MSCI 2018, all rights reserved. Dow Jones data (formerly Dow Jones Wilshire) provided by Dow Jones Indices. Bloomberg Barclays data provided by Bloomberg. Treasury bills © Stocks, Bonds, Bills, and Inflation Yearbook™, Ibbotson Associates, Chicago (annually updated work by Roger G. Ibbotson and Rex A. Sinquefield).
1. In US dollars MSCI developed markets country indices (net dividends). MSCI data © MSCI 2017, all rights reserved.
2. In US Dollars. US Small Cap is the Russell 2000 Index. Frank Russell Company is the source and owner of the trademarks, service marks, and copyrights related ot the Russell Indexes. International Small Cap is the MSCI World ex USA Small Cap Index (gross dividends). MSCI data copyright MSCI 2017, all rights reserved.
Adapted from “Investment Shock Absorbers,” Outside the Flags, February 2017. Dimensional Fund Advisors LP is an investment advisor registered with the Securities and Exchange Commission. All expressions of opinion are subject to change. This information is intended for educational purposes, and it is not to be construed as an offer, soliciation, recommendation, or endorsement of any particular security, products, or services. Performance does not reflect the expenses associated with management of an actual portfolio. Past performance is not a guarantee of future results.
Categories
Categories
Read Our Latest Articles Here
The Road Ahead: Financial Markets, Volatility, and Your Portfolio
When Retirement Arrives Suddenly: How to Cope when It’s “Too Soon”
Divorce and Social Security: Making the Right Calls