Since the 1950s, there have been numerous breakthroughs in the field of financial economics that have benefited both society and investors.
 One early example, resulting from research in the 1950s, is the insight that diversification can increase an investor’s wealth. Another example, resulting from research in the 1960s, is that market prices contain up-to-the-minute, relevant information about an investment’s expected return and risk. This means that market prices provide our best estimate of a security’s value. Seeking to outguess market prices and identify over- and undervalued securities is not a reliable way to improve returns.
This long history of innovation in research continues into the present day. As academics and market participants seek to better understand security markets, insights from their research can enable investors to better pursue their investment goals. In this article, we will focus on a series of recent breakthroughs into the relation between a firm’s profitability and its stock returns. As we will see, an important insight Dimensional drew from this research is how profitability and market prices can be used to increase the expected returns of a stock portfolio without having to attempt to outguess market prices.
Difference in Expected Returns
The price of a stock depends on a number of variables. For example, one variable is what a company owns minus what it owes (also called book value of equity). Expected profits, and the discount rate investors apply to these profits, are others. This discount rate is the expected return investors demand for holding the stock. The impact of market participants trading stocks is that market prices quickly find an equilibrium point where the expected return of a stock is commensurate with what investors demand.
Decades of theoretical and empirical research have shown that not all stocks have the same expected return. Stated simply, investors demand higher returns to hold some stocks and lower returns to hold others. Given this information, is there a systematic way to identify those differences?
Observing The Unobservable: Current and Future Profitability
Market prices and expected future profits contain information about expected returns. While we can readily observe market prices as stocks are traded (think about a ticker tape scrolling across a television screen), we cannot observe market expectations for future profits or future profitability, which is profits divided by book value. So how can we use an unobserved variable to tell us about expected returns?
A paper by Professors Eugene Fama and Kenneth French published in 2006[1] tackles this problem. Fama and French have authored more than 160 papers. They both rank within the top 10 most-cited fellows of the American Finance Association[2] and in 2013, Fama received a Nobel Prize in Economics Science for his work on securities markets.
Fama and French explored which financial data that is observable today contain information about expected future profitability. They found that a firm’s current profitability contains information about its profitability many years hence. What insights did Dimensional glean from this? Current profitability contains information about aggregate investor’s expectations of future profitability.
Measuring Profitability
The next academic breakthrough on profitability research was done by Professor Robert Novy-Marx, a world-renowned expert on empirical asset pricing. Building on the work of Fama and French, he explored the relation of different measures of current profitability to stock returns.
Profits equal revenues minus expenses. One particularly important insight Dimensional took from Novy-Marx’s work is that not all current revenues and expenses have information about future profits. For example, firms sometimes call a revenue or expense “extraordinary” when they do not expect it to recur in the future. If those revenues or expenses are not expected to recur, should investors expect them to contain information about future profitability? Probably not.
This is what Novy-Marx found when conducting his research. In a paper published in 2013,[3] he used US data since the 1960s and a measure of current profitability that excluded some non-recurring costs so that it could be a better estimate for expected future profitability. In doing so, he was able to document a strong relation between current profitability and future stock returns. That is, firms with higher profitability tended to have higher returns than those with low profitability. This is referred to as a profitability premium.
Around the same time, the Research team at Dimensional was also conducting research into profitability. They extended the work of Fama and French and found that in developed and emerging markets globally, current profitability has information about future profitability and that firms with higher profitability have had higher returns than those with low profitability. They also found that this observation held true when using different ways of measuring current profitability. These robustness checks are important to show that the profitability premiums observed in the original studies were not just due to chance.
Their research indicated that when using current profitability to increase the expected returns of a real-world strategy, it is important to have a thoughtful measure of profitability that provides a complete picture of a firm’s expenses while excluding revenues and expenses that may be unusual and therefore not expected to persist in the future.
The Cutting Edge: New Research
Many papers documenting profitability premiums globally have been written since 2013. An exciting forthcoming paper[4] by Professor Sunil Wahal provides powerful out-of-sample US evidence of profitability premiums. Wahal is an expert in market microstructure (how stocks trade) and empirical asset pricing.
Fama, French, and Novy-Marx’s research on profitability used US data from 1963 on. Why? Because when they conducted their research, reliable machine-readable accounting statement data required to compute profitability for US stocks was only available from 1963 on. Hand-collecting and cleaning accounting statement data and then transcribing it in a reliable fashion is no easy task and presents many a challenge for any researcher.
Wahal rose to those challenges. He gathered a team of research assistants to hand-collect accounting statement data from Moody’s Manuals from 1940 to 1963. By applying his (and his team’s) expertise in accounting, combined with a great deal of meticulous data checking, Wahal was able to produce reliable profitability data for all US stocks from 1940 to 1963. Using this data to measure the return differences between stocks with high vs. low profitability, Wahal found similar differences in returns to what had been found in the post-1963 period.
This research provides compelling evidence of the profitability premium pre-1963 and is a powerful out-of-sample test that strengthens the results found in earlier work.
The Size of the Profitability Premium
So how large has the profitability premium been historically? Large enough that investors who want to increase expected returns in a systematic way should take note. Exhibit 1 shows empirical evidence of the profitability premium in the US and globally. In the US, between 1964 and 2016, the Dimensional US High Profitability Index and the Dimensional US Low Profitability Index had annualized compound returns of 12.55% and 8.23%, respectively. The difference between these figures, 4.32%, is a measure of the realized profitability premium in the US over the corresponding time period. The non-US developed market realized profitability premium was 4.51% between 1990 and 2016. In emerging markets, the realized profitability premium was 5.21% between 1996 and 2016.
Exhibit 1. The Profitability Premium
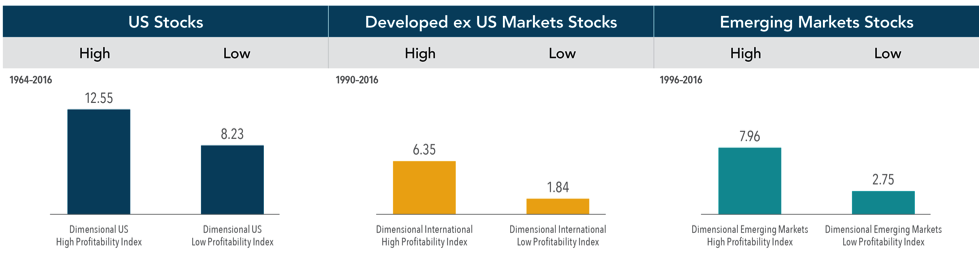
Profitability is measured as operating income before depreciation and amortization minus interest expense scaled by book. Indices are not available for direct investment. Their performance does not reflect the expenses associated with the management of an actual portfolio. Past performance is not a guarantee of future results. Index returns are not representative of actual portfolios and do not reflect costs and fees associated with an actual investment. Actual returns may be lower. See “Index Descriptions” in the appendix for descriptions of Dimensional and Fama/French index data. Eugene Fama and Ken French are members of the Board of Directors for and provide consulting services to Dimensional Fund Advisors LP.
Conclusion
In summary, there are differences in expected returns across stocks. Variables that tell us what an investor has to pay (market prices) and what they expect to receive (book equity and future profits) contain information about those expected returns. All else equal, the lower the price relative to book value and the higher the expected profitability, the higher the expected return.
What Dimensional has learned from its own work and the work of Professors Fama, French, Novy-Marx, and Wahal, as well as others, is that current profitability has information about expected profitability. This information can be used in tandem with variables like market capitalization or price-to-book ratios to extract the differences in expected returns embedded in market prices. As such, it allows investors to increase the expected return potential of their portfolio without trying to outguess market prices.
Glossary
Book Value of Equity: The value of stockholder’s equity as reported on a company’s balance sheet.
Discount Rate: Also known as the “required rate of return” this is the expected return investors demand for holding a stock.
Out-of-sample: A time period not included or directly examined in the data series used in a statistical analysis.
Market Microstructure: The examination of how markets function in a fine level of detail, this can include areas of inquiry such as: how traders interact, how security orders are placed and cleared and how information is relayed and priced.
Empirical Asset Pricing: A field of study that uses theory and data to understand how assets are priced.
Profitability Premium: The return difference between stocks of companies with high profitability over those with low profitability.
Realized Profitability Premium: The realized, or actual, return difference in a given time period between stocks of companies with high profitability over those with low profitability.
| [1]. Eugene Fama and Kenneth French, “Profitability, Investment, and Average Returns,” Journal of Financial Economics, vol. 82 (2006), 491–518.
[2]. G. William Schwert and Renè Stulz, “Gene Fama’s Impact: A Quantitative Analysis,” (working paper, Simon Business School, 2014, No. FR 14-17).
[3]. Robert Novy-Marx, “The Other Side of Value: The Gross Profitability Premium,” Journal of Financial Economics, vol. 108 (2013), 1–28.
[4]. Sunil Wahal, “The Profitability and Investment Premium: Pre-1963 Evidence,” (December 29, 2016). Available at SSRN: ssrn.com/abstract=2891491.
Source: Dimensional Fund Advisors LP.
The Dimensional Indices have been retrospectively calculated by Dimensional Fund Advisors LP and did not exist prior to their index inceptions dates. Accordingly, results shown during the periods prior to each Index’s index inception date do not represent actual returns of the Index. Other periods selected may have different results, including losses. Backtested index performance is hypothetical and is provided for informational purposes only to indicate historical performance had the index been calculated over the relevant time periods. Backtested performance results assume the reinvestment of dividends and capital gains.
There is no guarantee investment strategies will be successful. Diversification does not eliminate the risk of market loss.
All expressions of opinion are subject to change. This article is distributed for informational purposes, and it is not to be construed as an offer, solicitation, recommendation, or endorsement of any particular security, products, or services.
Eugene Fama is a member of the Board of Directors for and provides consulting services to Dimensional Fund Advisors LP. |
|
Evolution of Financial Research: The Profitability Premium
Since the 1950s, there have been numerous breakthroughs in the field of financial economics that have benefited both society and investors.
This long history of innovation in research continues into the present day. As academics and market participants seek to better understand security markets, insights from their research can enable investors to better pursue their investment goals. In this article, we will focus on a series of recent breakthroughs into the relation between a firm’s profitability and its stock returns. As we will see, an important insight Dimensional drew from this research is how profitability and market prices can be used to increase the expected returns of a stock portfolio without having to attempt to outguess market prices.
Difference in Expected Returns
The price of a stock depends on a number of variables. For example, one variable is what a company owns minus what it owes (also called book value of equity). Expected profits, and the discount rate investors apply to these profits, are others. This discount rate is the expected return investors demand for holding the stock. The impact of market participants trading stocks is that market prices quickly find an equilibrium point where the expected return of a stock is commensurate with what investors demand.
Decades of theoretical and empirical research have shown that not all stocks have the same expected return. Stated simply, investors demand higher returns to hold some stocks and lower returns to hold others. Given this information, is there a systematic way to identify those differences?
Observing The Unobservable: Current and Future Profitability
Market prices and expected future profits contain information about expected returns. While we can readily observe market prices as stocks are traded (think about a ticker tape scrolling across a television screen), we cannot observe market expectations for future profits or future profitability, which is profits divided by book value. So how can we use an unobserved variable to tell us about expected returns?
A paper by Professors Eugene Fama and Kenneth French published in 2006[1] tackles this problem. Fama and French have authored more than 160 papers. They both rank within the top 10 most-cited fellows of the American Finance Association[2] and in 2013, Fama received a Nobel Prize in Economics Science for his work on securities markets.
Fama and French explored which financial data that is observable today contain information about expected future profitability. They found that a firm’s current profitability contains information about its profitability many years hence. What insights did Dimensional glean from this? Current profitability contains information about aggregate investor’s expectations of future profitability.
Measuring Profitability
The next academic breakthrough on profitability research was done by Professor Robert Novy-Marx, a world-renowned expert on empirical asset pricing. Building on the work of Fama and French, he explored the relation of different measures of current profitability to stock returns.
Profits equal revenues minus expenses. One particularly important insight Dimensional took from Novy-Marx’s work is that not all current revenues and expenses have information about future profits. For example, firms sometimes call a revenue or expense “extraordinary” when they do not expect it to recur in the future. If those revenues or expenses are not expected to recur, should investors expect them to contain information about future profitability? Probably not.
This is what Novy-Marx found when conducting his research. In a paper published in 2013,[3] he used US data since the 1960s and a measure of current profitability that excluded some non-recurring costs so that it could be a better estimate for expected future profitability. In doing so, he was able to document a strong relation between current profitability and future stock returns. That is, firms with higher profitability tended to have higher returns than those with low profitability. This is referred to as a profitability premium.
Around the same time, the Research team at Dimensional was also conducting research into profitability. They extended the work of Fama and French and found that in developed and emerging markets globally, current profitability has information about future profitability and that firms with higher profitability have had higher returns than those with low profitability. They also found that this observation held true when using different ways of measuring current profitability. These robustness checks are important to show that the profitability premiums observed in the original studies were not just due to chance.
Their research indicated that when using current profitability to increase the expected returns of a real-world strategy, it is important to have a thoughtful measure of profitability that provides a complete picture of a firm’s expenses while excluding revenues and expenses that may be unusual and therefore not expected to persist in the future.
The Cutting Edge: New Research
Many papers documenting profitability premiums globally have been written since 2013. An exciting forthcoming paper[4] by Professor Sunil Wahal provides powerful out-of-sample US evidence of profitability premiums. Wahal is an expert in market microstructure (how stocks trade) and empirical asset pricing.
Fama, French, and Novy-Marx’s research on profitability used US data from 1963 on. Why? Because when they conducted their research, reliable machine-readable accounting statement data required to compute profitability for US stocks was only available from 1963 on. Hand-collecting and cleaning accounting statement data and then transcribing it in a reliable fashion is no easy task and presents many a challenge for any researcher.
Wahal rose to those challenges. He gathered a team of research assistants to hand-collect accounting statement data from Moody’s Manuals from 1940 to 1963. By applying his (and his team’s) expertise in accounting, combined with a great deal of meticulous data checking, Wahal was able to produce reliable profitability data for all US stocks from 1940 to 1963. Using this data to measure the return differences between stocks with high vs. low profitability, Wahal found similar differences in returns to what had been found in the post-1963 period.
This research provides compelling evidence of the profitability premium pre-1963 and is a powerful out-of-sample test that strengthens the results found in earlier work.
The Size of the Profitability Premium
So how large has the profitability premium been historically? Large enough that investors who want to increase expected returns in a systematic way should take note. Exhibit 1 shows empirical evidence of the profitability premium in the US and globally. In the US, between 1964 and 2016, the Dimensional US High Profitability Index and the Dimensional US Low Profitability Index had annualized compound returns of 12.55% and 8.23%, respectively. The difference between these figures, 4.32%, is a measure of the realized profitability premium in the US over the corresponding time period. The non-US developed market realized profitability premium was 4.51% between 1990 and 2016. In emerging markets, the realized profitability premium was 5.21% between 1996 and 2016.
Exhibit 1. The Profitability Premium
Profitability is measured as operating income before depreciation and amortization minus interest expense scaled by book. Indices are not available for direct investment. Their performance does not reflect the expenses associated with the management of an actual portfolio. Past performance is not a guarantee of future results. Index returns are not representative of actual portfolios and do not reflect costs and fees associated with an actual investment. Actual returns may be lower. See “Index Descriptions” in the appendix for descriptions of Dimensional and Fama/French index data. Eugene Fama and Ken French are members of the Board of Directors for and provide consulting services to Dimensional Fund Advisors LP.
Conclusion
In summary, there are differences in expected returns across stocks. Variables that tell us what an investor has to pay (market prices) and what they expect to receive (book equity and future profits) contain information about those expected returns. All else equal, the lower the price relative to book value and the higher the expected profitability, the higher the expected return.
What Dimensional has learned from its own work and the work of Professors Fama, French, Novy-Marx, and Wahal, as well as others, is that current profitability has information about expected profitability. This information can be used in tandem with variables like market capitalization or price-to-book ratios to extract the differences in expected returns embedded in market prices. As such, it allows investors to increase the expected return potential of their portfolio without trying to outguess market prices.
Glossary
Book Value of Equity: The value of stockholder’s equity as reported on a company’s balance sheet.
Discount Rate: Also known as the “required rate of return” this is the expected return investors demand for holding a stock.
Out-of-sample: A time period not included or directly examined in the data series used in a statistical analysis.
Market Microstructure: The examination of how markets function in a fine level of detail, this can include areas of inquiry such as: how traders interact, how security orders are placed and cleared and how information is relayed and priced.
Empirical Asset Pricing: A field of study that uses theory and data to understand how assets are priced.
Profitability Premium: The return difference between stocks of companies with high profitability over those with low profitability.
Realized Profitability Premium: The realized, or actual, return difference in a given time period between stocks of companies with high profitability over those with low profitability.
[2]. G. William Schwert and Renè Stulz, “Gene Fama’s Impact: A Quantitative Analysis,” (working paper, Simon Business School, 2014, No. FR 14-17).
[3]. Robert Novy-Marx, “The Other Side of Value: The Gross Profitability Premium,” Journal of Financial Economics, vol. 108 (2013), 1–28.
[4]. Sunil Wahal, “The Profitability and Investment Premium: Pre-1963 Evidence,” (December 29, 2016). Available at SSRN: ssrn.com/abstract=2891491.
Source: Dimensional Fund Advisors LP.
The Dimensional Indices have been retrospectively calculated by Dimensional Fund Advisors LP and did not exist prior to their index inceptions dates. Accordingly, results shown during the periods prior to each Index’s index inception date do not represent actual returns of the Index. Other periods selected may have different results, including losses. Backtested index performance is hypothetical and is provided for informational purposes only to indicate historical performance had the index been calculated over the relevant time periods. Backtested performance results assume the reinvestment of dividends and capital gains.
There is no guarantee investment strategies will be successful. Diversification does not eliminate the risk of market loss.
All expressions of opinion are subject to change. This article is distributed for informational purposes, and it is not to be construed as an offer, solicitation, recommendation, or endorsement of any particular security, products, or services.
Eugene Fama is a member of the Board of Directors for and provides consulting services to Dimensional Fund Advisors LP.
Categories
Categories
Read Our Latest Articles Here
Retirement Cash Flow: Tax-Efficient Planning
Inherited a Spousal IRA? Here’s What You Should Do Next
Blended Family Finance: Mistakes to Avoid and Conversations to Have